Curated OER
The Importance of Imports
Students explore world trade by examining items they find at home and listing countries those items came from. Data is displayed on a map and charted according to continent. They discuss how products are transported.
Curated OER
Gravity Versus the Mighty Egg
Students design, revise and construct a method for protecting an egg from cracking when it is dropped from a height. They work in small groups to develop their protection method and then collect and analyze data as a class when each...
Curated OER
What Are You Eating?
Discover the calorie content of foods by observing how much heat they produce in water. If you have a calculator-based laboratory (CBL™) insturment for collecting data, then this laboratory worksheet will not need any changes. If...
Curated OER
Becoming A Career Detective (Part 2)
Third graders review and expand their discussion of job training and education resources. They work in small groups to find information about the types of training people need to do specific jobs and use data from interviews carried out...
Curated OER
Writing Chemical Formulas
Learners study how to write chemical fomulas by reviewing the combinations atoms form into compounds. They write a procedure to test various substances and name the compounds and write formulas. As they construct models for formulas and...
Curated OER
Displaying The Data
Pupils engage in a research project to find information about one's personal family heritage. They collect information by conducting family interviews. Students use the data to create a graph, map, and timeline. Then pupils take part in...
Curated OER
Box Plots
Learners review the concept of median, explore how to calculate quartiles for any size data set and experience how to build a box plot.
Curated OER
Gathering, Recording, and Presenting Data
Sixth graders use the local newspaper to find and discuss examples of uses of statistics and the ways in which the information is presented. They create and represent their own set of data showing how students get to school each day.
Curated OER
Creeping
Learners observe, measure, and graph a model of slow down slope movement representing soil creep. This task assesses students' abilities to collect, record, and organize data, set up graph axes, plot data points, draw line graphs, apply...
Curated OER
Get a Half-life!
Students use m&m candies as their sample set. They begin by counting the total number of candies to determine their sample size. Students put the candies into a cup and shake them gently before pouring them onto a paper plate. Count...
Curated OER
Trouble in the Troposphere
Students Use data sets from MY NASA DATA to produce graphs comparing monthly and yearly ozone averages of several U.S. cities. They analyze and evaluate the data and predict trends based on the data. In addition, they discuss and...
Curated OER
More of U.S.
Explore graphical representation of a real-life data set and determine the exponential regression model for the data in your classroom. High schoolers also compare the estimated value to the given value by determining the percent error.
Curated OER
Lines of Best Fit
High schoolers determine if there is an associationm in a scatter plot of data. They analyze data through predictios, comparisons, and applications. Students calculate the line of best fit using a graphing calculator. They display data...
Curated OER
Bodacious Buttons
First graders graph a data set. Given a set of buttons, 1st graders sort them into categories using specific attributes. They graph the number of buttons in their set based on their attributes using a variety of graphs. Students share...
Curated OER
Analyzing Tree Rings to Determine Climate Change
Students examine how to locate and access data sets. In this climate change activity students import data into Excel and graph it.
Curated OER
Weather instruments
Students explore weather instruments. In this weather lesson, students make rain gauges, anemometers, and barometers following the instructions given in the lesson. Students set up a weather station using their instruments and record and...
Curated OER
Seeds in Fall...Collect Them All!
Classify seeds by attributes such as size, shape and color! Learners classify seeds using a dichotomous key. They identify human behaviors that have a positive impact on preserving seed and plant biodiversity.
Curated OER
Coral Snapshots
Using photographs and a coral reef identification key, junior marine biologists compare changes in coral cover for a No-Take Area and the surrounding unprotected area. The data that is collected is then analyzed for richness,...
Curated OER
Real Estate Lesson: Monthly Payments
Students examine real-world data relating to real estate. They conduct Internet research, record data regarding real estate in major cities, graph the data, calculate mortgage payments using a mortgage calculator, and analyze the data.
Curated OER
Education for Global Peace
Fifth graders construct data graphs based upon sets of data. In this graphing lesson, 5th graders read the text If the World Were a Village and discuss how types of graphs accurately represent a large population. Students construct their...
Curated OER
Show Me!
Students analyze and interpret graphs. In this graphing lesson, students view a video and construct their own graphs (line, circle, bar) from given sets of data.
Curated OER
String Of Lights
Students collect, graph and analyze data. In this statistics lesson, students compare data using different types of graphs. They make predictions, draw conjectures as they analyze bulbs used in a holiday light set.
Curated OER
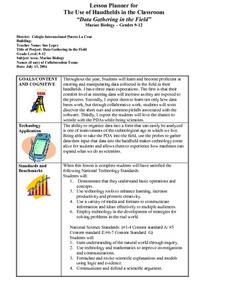
??Data Gathering in the Field??
Students demonstrate that they understand basic operations and concpets, students further use technology to enhance learning, increase productivity and and promote their creativity. Students gain an understanding of the world through...
Curated OER
Excavating the Trash
Students look at a day's accumulation of recyclable trash from first through fifth grade classrooms, not knowing which classes it came from. After setting up a collection sheet for data, students remove items from the receptacle and...
