Curated OER
Lifting a Load
Learners experiments with levers to determine if the amount of force needed to lift a load is always the same. In this physics lesson, students use Lab-Pro data collector as they experiment with the fulcrum placement to measure the work...
Curated OER
Venn Diagram and UK Basketball
Students analyze data and make inferences. In this algebra lesson, students collect and analyze data as they apply it to the real world.
Curated OER
Algebra: Reaching New Heights
Students work in pairs to measure their arm span and height and record them on a class chart. The class works together to create a scattergram to display the data. Class discussion focuses on interpreting the scattergram.
Curated OER
EXCEL It!
Young scholars surf the Web gathering information about graphs. The data collected is incorporated into an Excel spreadsheet and graphs of varying nature generated to further enhance student understanding.
Curated OER
Hollywood's Top Ten
Students gather data on top 10 highest grossing movies, and make a bar graph and a pictogram.
Curated OER
Genetic Drift
Students use a mathematical simulation of genetic drift to answer questions about the factors that influence this evolutionary process. They run a series of simulations varying allele frequency and population size and then analyze their...
Curated OER
Trajectory Perplexity
Students investigate measuring angles correctly through projectiles. In this geometry lesson, students launch a projectile to investigate the importance of how to measure an angle correctly and to explore trajectory. They collect...
Curated OER
Measures of Central Tendency
Students analyze data using central tendencies. In this statistics lesson, students collect and analyze data using the mean, median and mode. They create a power point representing the different measures of central tendency.
Curated OER
Calculating Theoretical & Experimental Probability
Students collect data by conducting a survey of fellow classmates. They investigate the relationship between estimates obtained from samples and theoretical probabilities. Answer keys included.
Curated OER
Water, Water Everywhere
Students monitor a local creek. In this environmental water lesson, students conduct an environmental study of a local creek by monitoring the temperature and water quality over a period of time, then submit data to the Global Water...
Curated OER
Global Warming Statistics
Students research and collect data regarding temperature changes for a specific location and find the mean, median, and mode for their data. In this climate change lesson, students choose a location to research and collect data regarding...
Curated OER
Graphics Creation and Statistical Interpretation: Relating Local Economics and the Global Environment
Students apply statistics, and graphical interpretation to economics, the environment and populations. In this statistical lesson students construct graphical displays and classify data.
Curated OER
RIP M&M's
Students solve theoretical probability problems. In this algebra lesson, students apply the concept of probabilities to solving real life scenarios. They collect data and graph it using experimental probability.
Curated OER
Specific Heat of Metals
Students determine the specific heat of unknown metals. based on their hypothesis and design proposal. They analyze the findings of the specific heat of the unknown metals. Students complete this by questions, hypothesis, rationale,...
Curated OER
Operation Weather Station
Students work in cooperative groups to create a working weather station. Tkey use the weather station to collect weather data over a one-week period. Students compare the data from their weather station to actual weather information...
Curated OER
The Big Hand Challenge
Students utilize a computer spreadsheet to record and analyze data. In this problem solving activity, students compare their hand size to that of the principal. Students understand standard and nonstandard measurement.
Curated OER
The Appearance of a Graph
Sixth graders understand that the appearance and increment used on the x and y axis in a graph change how it looks. In this graphing lesson, 6th graders work in pairs and interpret graphs using different axes. Students collect graphs...
Curated OER
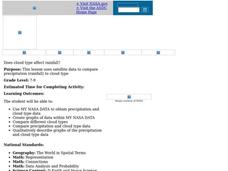
Does Cloud Type Affect Rainfall?
Student uses MY NASA DATA to obtain precipitation and cloud type data. They create graphs of data within MY NASA DATA. They compare different cloud types as well as precipitation types. They describe graphs of the precipitation and cloud...
Curated OER
Bean Sprout
Student will track the growth of his/her bean sprout with sunlight and without sunlight over the course of 3 weeks. They will enter the results into an excel data base then graph the results of both variables to make the comparison.
Curated OER
Mapping the Census
High schoolers learn why the census makes a difference. In this U.S. Census lesson plan, students learn the key elements of cartography, examine the difference between data and their representation, and create a map using census data.
Curated OER
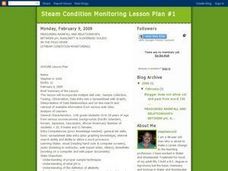
Measuring Rainfall and Relationships Between pH, Alkalinity and Suspended Solids in the Pago River
Eleventh graders test the pH and alkalinity of Pago River. In this ecology instructional activity, 11th graders collect data and use spreadsheet to graph results. They analyze and share their findings with the class.
Curated OER
Graphing Favorite Fruit
Third graders take poll and sort data, enter the data to create a spreadsheet and create bar and pie graphs.
Curated OER
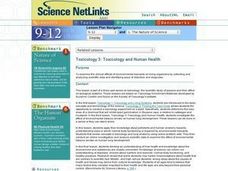
Toxicology And Human Health
Students examine the clinical effects of environmental toxicants on living organisms by collecting and analyzing scientific data and identifying ways of detection and diagnosis.
Curated OER
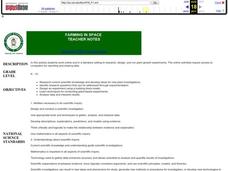
Farming in Space
Students research, design, and run plant growth experiments online. They explore websites, design an experiment using an animation-based building block program, construct a soda bottle hydroponic production unit and a cardboard plant...


