Curated OER
Get a Half-life!
Students use m&m candies as their sample set. They begin by counting the total number of candies to determine their sample size. Students put the candies into a cup and shake them gently before pouring them onto a paper plate. Count...
Curated OER
Comparison of Snow Cover on Different Continents
Pupils use the Live Access Server (LAS) to form maps and a numerical text file of snow cover for each continent on a particular date. They analyze the data for each map and corresponding text file to determine an estimate of snow cover...
Curated OER
Strings and Springs
Ninth graders explore physics with springs and strings. In this force and motion lesson, 9th graders rotate through four stations exploring how various springs stretch and bounce, and how mass and length affect a pendulum's swing. They...
Curated OER
Graphing Made Easy
Fourth graders discover the appropriate way to construct and analyze bar, line, picto, and circle graphs. They set up frequency tables and perform some statistical analysis (mean, median, and mode) on their data.
Curated OER
From Probability to Combinatorics and Number Theory
Students see how division is used to help solve probability problems. They use tables as data structures where they are used to count outcomes and to compute probabilities. Students use games to help solve probability problems.
Curated OER
Histograms and Statistical Graphics
In this statistics worksheet, young scholars solve 6 data problems. They construct a histogram of given data, they create a frequency polygon, and a stem and leaf diagram. Students create a dot plot and a pie chart for given data sets....
Curated OER
Are Taxes "Normal?"
Students explore the concept of normal distribution. In this normal distribution lesson, students find the normal distribution of taxes in the 50 US states. Students make histograms, frequency tables, and find the mean and median of tax...
Curated OER
Party, Party, Party
Second graders conduct investigations with counting, comparing, organizing, analyzing, displaying and interpreting data. They pose questions for investigation and collect the data. Students display the data in tally charts, uniform...
Curated OER
Math: Will The Airplane Get Off the Ground?
Learners use data from real-life models to calculate and compare the force required for an airplane of a given weight to become airborne. They use a graphing calculator to evaluate data and use the World Wide Web to access data.
EngageNY
Substituting to Evaluate Addition and Subtraction Expressions
Substitute this resource for what you used to use. Learners identify patterns in data tables and write addition and subtraction expressions to represent relationships. Substitution allows them to solve problems in context in the 20th...
NOAA
What's the Difference?
Due to the isolation of seamounts, their biodiversity offers a great deal of information on the development of biological and physical processes. Pupils use simple cluster analysis to rate the similarity and differences in biological...
Curated OER
Box Plots
Learners review the concept of median, explore how to calculate quartiles for any size data set and experience how to build a box plot.
Curated OER
Sustainable Development and Canada's Natural Resources
Students use text information, data and graphs to explain what sustainable development is, and to investigate the rate of consumption of Canada's natural resources. In groups, they graph their findings.
Curated OER
Global Statistics
Learners select appropriate data to determine the mean, median, mode and range of a set of data. They calculate the statistical data on literacy rates and life expectancy within each geographic region of the world. Students determine...
Curated OER
Harry Potter Research Project
Students work together to complete a research project on Harry Potter. They write a research question and develop a survey to give to their classmates. Using the results, they create a graph and draw conclusions about the data collected.
Curated OER
Keep It Cool
Students complete a science experiment to study insulation, heat transfer, and permafrost. In this permafrost study lesson, students design and test a soda insulator. Students graph their class data and discuss the results. Students...
Curated OER
The Land of Immigrants
Students access information and data about US immigration using the Internet and other sources. They identify from research data the countries from which the largest number of immigrants to the US come from and create a database of these...
Curated OER
Variables and Patterns: Determining an appropriate scale while graphing
Sixth graders determine appropriate scales when graphing data. In this graphing lesson, 6th graders use an the applet "Graph It" to determine what is an appropriate scale for their data.
Curated OER
Rocketsmania And Slope
Students use a professional basketball team's data and graph it on a coordinate plane. They draw a line of regression and finding its equation. They access a website containing statistics for the Houston Rockets basketball team to solve...
Curated OER
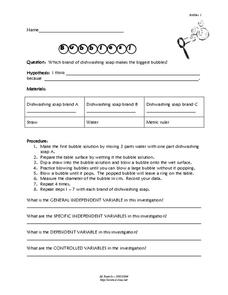
Bubbles
Students experiment bubbles. In this scientific method lesson, students identify variables used in proper experiment design. Students conduct experiments with different brands of dish-washing detergent to determine which brand makes the...
Curated OER
Investigating Median, Mode, and Mean
Students develop strategies to organize data while following teacher demonstration. They calculate the mean, median and mode of a data set while determining the relationships between the numbers. They analyze data from tables and double...
Curated OER
Exploring Function Graphs
Tenth graders investigate three different sets of data that relate temperature to another variable in the physical world. These illustrate linear, inverse and exponential relationships.
Curated OER
Get a Half-life!
High schoolers explore decay functions and the half-life of a substance. Through an M&M activity with calculators, students collect and graph data. They determine the linear, quadratic and exponential functions of the graph. High...
Curated OER
Tiling a Patio
Fifth graders practice, with spreadsheets, to demonstrate how to determine the number of tiles needed to create a patio. They use pictures and gathered data to determine a pattern that can be used to solve problems. Students create a...
Other popular searches
- Data Tables
- Data Displays
- Displaying Data
- Create Data Table
- Data Table and Graph
- Creating Data Tables
- Science Data Tables
- Creating a Data Table
- Making Data Tables
- Organizing Data in Tables
- Solar System Data Table
- Data Tables and Graphing


