Bowland
In the Olympics, are Women Improving Faster than Men?
Will the time come when women outperform men at the Olympic Games?Scholars investigate gender differences in Olympic Games performances. They study the historical participation of women and then analyze data to determine if women will...
National Council of Teachers of Mathematics
Eruptions: Old Faithful Geyser
How long do we have to wait? Given several days of times between eruptions of Old Faithful, learners create a graphical representation for two days. Groups combine their data to determine an appropriate wait time between eruptions.
Curated OER
Comparing Data on Graph A and Graph B
Second graders gather and graph data. In this graphing lesson, 2nd graders collect data and graph this information using tally charts, bar graphs, pictographs, or tables. They make predictions about the outcomes.
Raytheon
Data Analysis and Interpretation
For this data analysis and interpretation worksheet, learners use charts, graphs, statistics to solve 42 pages of problems with answer key included.
Code.org
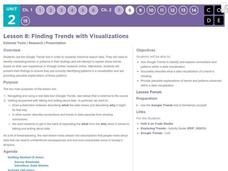
Finding Trends with Visualizations
Pupils often hear about trends, but they don't always see them. The eighth lesson in a unit of 15 requires individuals to use the Google Trends tool. Class members identify patterns in the visualization before presenting the patterns...
Council for Economic Education
Inflation Data: Is the Economy Healthy?
What stories do current trends tell about society, fashion, and the future? Scholars investigate the concept of inflation and its impact on the future of the American economy. They compile current economic data to determine the level of...
Council for Economic Education
Unemployment Data: Is the Economy Healthy?
The United States will never see a time when the unemployment rate hits 0%. Why? Scholars research economic data to uncover clues hidden in the unemployment rate at any given time. A short video as well as research activities help...
Statistics Education Web
Saga of Survival (Using Data about Donner Party to Illustrate Descriptive Statistics)
What did gender have to do with the survival rates of the Donner Party? Using comparative box plots, classes compare the ages of the survivors and nonsurvivors. Using the same method, individuals make conclusions about the gender and...
Council for Economic Education
Economic Data Lesson: Economic Policy Options
Can you make decisions that will impact millions of people around the nation? Scholars research the role of the Federal Reserve, and its Chairman, on the economic outlook of the country. They analyze current trends in unemployment,...
EduGAINs
Data Management
Using a carousel activity, class members gain an understanding of the idea of inferences by using pictures then connecting them to mathematics. Groups discuss their individual problems prior to sharing them with the entire class. The...
US Department of Commerce
Community Change
America is a country on the move. Analyzing data from the Census Bureau, class members gauge the people moving in and out of their areas. An interactive web feature allows pupils to see who is moving out and moving in, while discussion...
Curated OER
Trends of Snow Cover and Temperature in Alaska
High schoolers gather historical snow cover and temperature data from the MY NASA DATA Web site. They compare this data to data gathered using ground measurements from the ALISON Web site for Shageluk Lake. They graph both sets of data...
Curated OER
Smoking Today = Smoking Tomorrow
Examine statistical data to recognize the relationship of statistics to real-world issues. Pupils navigate e-stat using the Internet and find data about social issues. They complete a worksheet with their data and create an anti-smoking...
NASA
A Different Perspective
What can we learn from the data? Young scholars analyze actual solar data to answer specific questions. The activity presents an opportunity for an open-ended investigation of the data to conclude a five-part series on solar winds.
Curated OER
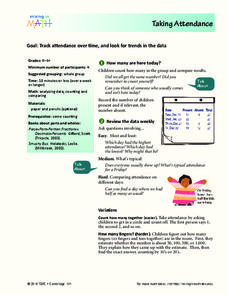
Taking Attendance
Young mathematicians record and analyze data. They will take attendance for their class and compare to other days. Then discuss ways to count who is present. They may also show the amount of students present using fractions.
CCSS Math Activities
Social Security Trust Fund
Will Social Security still be around when you retire? Given data on the predicted balance of the social security fund over time, scholars plot the points on a coordinate grid and determine if a quadratic regression fits the data. They...
Bowland
Fares Not Fair
What would be a fair fare for a taxi? to answer the questions requires young mathematicians to analyze data on fuel prices and taxi cab fares. They determine and justify a fair fare price.
Curated OER
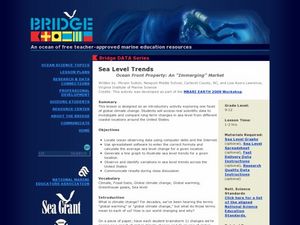
Sea Level Trends ~ Ocean Front Property: An "Immerging" Market
Young oceanographers take a look at sea level data from several cities over a few centuries. They use the data to fuel a discussion about what kind of changes are taking place and the impact they are having on the coastal ecosystems....
National Wildlife Federation
When It Rains It Pours More Drought and More Heavy Rainfall
Which is worse — drought or flooding? Neither is helpful to the environment, and both are increasing due to climate change. The 16th lesson in a series of 21 covers the average precipitation trends for two different climates within the...
National Wildlife Federation
Wherefore Art Thou, Albedo?
In the sixth lesson in a series of 21, scholars use NASA data to graph and interpret albedo seasonally and over the course of multiple years. This allows learners to compare albedo trends to changes in sea ice with connections to the...
Curated OER
Weather, Data, Graphs and Maps
Learners collect data on the weather, graph and analyze it. For this algebra lesson, students interpret maps and are able to better plan their days based on the weather reading. They make predictions based on the type of clouds they see.
Intel
Track the Trends
Allow your classes to research what interests them. An engaging STEM lesson, the fourth in the series of six, asks individuals to choose a topic of interest and analyze the data through regression models. The regression equations allow...
Curated OER
Sound Walk: Discovering Data and Applying Range, Mode, and Mean
Elementary schoolers sharpen their listening skills as they use sound maps, tallies, and line plots to organize and interpret data. Everyone takes a "sound walk," and focuses on the sounds around them. They chart and tabulate the sounds...
Curated OER
How Does the Earth's Energy Budget Relate to Polar Ice?
Learners use satellite data to see how radiation budget relates to the ice that is present in the North. In this energy lesson students correlate data to see a relationship.


