EngageNY
Graphs of Quadratic Functions
How high is too high for a belly flop? Learners analyze data to model the world record belly flop using a quadratic equation. They create a graph and analyze the key features and apply them to the context of the video.
EngageNY
Graphs Can Solve Equations Too
There are many equations Algebra I learners are not ready to solve. Graphing to solve gives them a strategy to use when they are unsure of an algebraic approach to solve the problem. The lesson exposes learners to a wide variety of types...
EngageNY
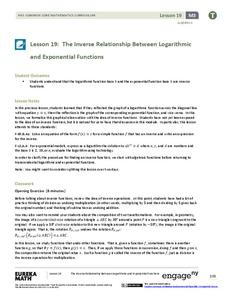
The Inverse Relationship Between Logarithmic and Exponential Functions
Introducing inverse functions! The 20th installment of a 35-part lesson encourages scholars to learn the definition of inverse functions and how to find them. The lesson considers all types of functions, not just exponential and...
CK-12 Foundation
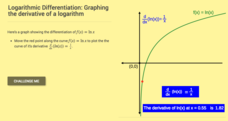
Logarithmic Differentiation: Graphing the Derivative of a Logarithm
Log the values of the derivative of a logarithm. The interactive plots the derivative of the natural logarithm. Learners first determine the derivative of natural logarithm and the general logarithm. Using the formulas for the...
Flipped Math
Calculus AB/BC - Determining Intervals on Which a Function is Increasing or Decreasing
Going up? Wait, it might be going down! Learners watch a video to see how to use the derivative and critical points to find where a function is either increasing or decreasing. Individuals use the rate of change to solve real-world...
Flipped Math
Calculus AB/BC - Determining Concavity of Functions over Their Domains
Time to take a second look at derivatives finding concavity. While watching the video, learners find out the definition of concavity. Individuals see how to determine whether an interval is concave up or concave down using graphs and the...
Flipped Math
Calculus AB/BC - Defining the Derivative of a Function and Using Derivative Notation
Pupils learn how to find the derivative of a function by applying the definition using limits. Learners understand that the derivative provides the slope of the tangent line and use that information to find the equation of the tangent...
EngageNY
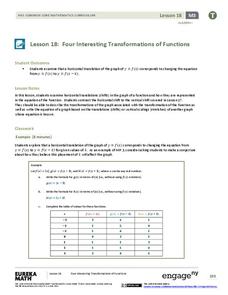
Four Interesting Transformations of Functions (Part 2)
What happens to a function whose graph is translated horizontally? Groups find out as they investigate the effects of addition and subtraction within a function. This nineteenth instructional activity in a 26-part series focuses on...
Curated OER
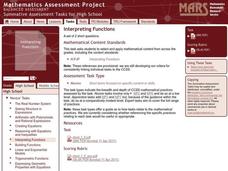
Interpreting Functions
Interpreting graphs of functions is addressed in a short worksheet. Distance as a function of time is sketched on a graph, and a few quick questions ask about their meaning. This would make a good short assessment, or a nice worksheet to...
Curated OER
Functions
For this functions worksheet, students solve and complete 11 different types of problems. First, they find the coordinates of all points on the graph of each equation where the tangents to the graph are horizontal. Then, students write...
Curated OER
Applications of Derivatives: Finding Maxima and Minima
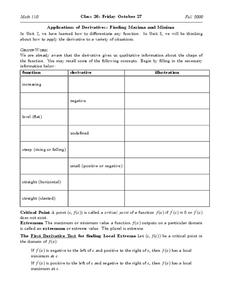
For this derivatives worksheet, students complete a function chart by telling the type of function, the derivative, and making an illustration of the concept. They find the intervals at which a given function is increasing or decreasing....
EngageNY
Translating Graphs of Functions
If you know one, you know them all! Parent functions all handle translations the same. This lesson examines the quadratic, absolute value, and square root functions. Pupils discover the similarities in the behavior of the graphs when...
EngageNY
Comparing Linear and Exponential Models Again
Making connections between a function, table, graph, and context is an essential skill in mathematics. Focused on comparing linear and exponential relationships in all these aspects, this resource equips pupils to recognize and interpret...
Charleston School District
Review Unit 4: Linear Functions
It's time to show what they know! An assessment review concludes a five-part series about linear functions. It covers all concepts featured throughout the unit, including linear equations, graphs, tables, and problem solving.
EngageNY
Graphs of Simple Nonlinear Functions
Time to move on to nonlinear functions. Scholars create input/output tables and use these to graph simple nonlinear functions. They calculate rates of change to distinguish between linear and nonlinear functions.
EngageNY
Graphs of Exponential Functions
What does an exponential pattern look like in real life? After viewing a video of the population growth of bacteria, learners use the real-life scenario to collect data and graph the result. Their conclusion should be a new type of graph...
EngageNY
Analyzing a Graph
Collaborative groups utilize their knowledge of parent functions and transformations to determine the equations associated with graphs. The graph is then related to the scenario it represents.
EngageNY
Structure in Graphs of Polynomial Functions
Don't allow those polynomial functions to misbehave! Understand the end behavior of a polynomial function based on the degree and leading coefficient. Learners examine the patterns of even and odd degree polynomials and apply them to...
EngageNY
Graphing the Sine and Cosine Functions
Doing is more effective than watching. Learners use spaghetti to discover the relationship between the unit circle and the graph of the sine and cosine functions. As they measure lengths on the unit circle and transfer them to a...
EngageNY
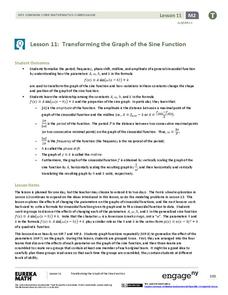
Transforming the Graph of the Sine Function
Build a solid understanding of trigonometric transformations through exploration. Learners work in teams to analyze the effects of different algebraic components on the graph of a sine function.
EngageNY
Graphing Quadratic Functions from Factored Form
How do you graph a quadratic function efficiently? Explore graphing quadratic functions by writing in intercept form with a lesson that makes a strong connection to the symmetry of the graph and its key features before individuals write...
EngageNY
Graphs of Functions and Equations
Explore the graphs of functions and equations with a resource that teaches scholars how to graph functions as a set of input-output points. They learn how the graph of a function is the graph of its associated equation.
EngageNY
Representations of a Line
Explore how to graph lines from different pieces of information. Scholars learn to graph linear functions when given an equation, given two points that satisfy the function, and when given the initial value and rate of change. They solve...
EngageNY
Graphing Factored Polynomials
Young mathematicians graph polynomials using the factored form. As they apply all positive leading coefficients, pupils demonstrate the relationship between the factors and the zeros of the graph.


