EngageNY
Structure in Graphs of Polynomial Functions
Don't allow those polynomial functions to misbehave! Understand the end behavior of a polynomial function based on the degree and leading coefficient. Learners examine the patterns of even and odd degree polynomials and apply them to...
EngageNY
Experiments and the Role of Random Assignment
Time to experiment with mathematics! Learners study experimental design and how randomization applies. They emphasize the difference between random selection and random assignment and how both are important to the validation of the...
EngageNY
Margin of Error When Estimating a Population Mean (part 1)
We know that sample data varies — it's time to quantify that variability! After calculating a sample mean, pupils calculate the margin of error. They repeat the process with a greater number of sample means and compare the results.
EngageNY
Designing Your Own Game
Your classes become video game designers for a day! They utilize their matrices, vectors, and transformation skills to create and design their own game images. The complex task requires learners to apply multiple concepts to create their...
EngageNY
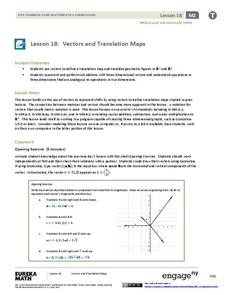
Vectors and Translation Maps
Discover the connection between vectors and translations. Through the lesson, learners see the strong relationship between vectors, matrices, and translations. Their inquiries begin in the two-dimensional plane and then progress to the...
Balanced Assessment
Vacation in Bramilia
This performance task gives the population model of different types of flies and asks scholars to analyze the two populations. After interpreting the functions individually, participants compare the two populations and find the time when...
PBL Pathways
Arch Project
Model real-life structures with mathematics. A project-based lesson presents a problem situation requiring classes to develop a function to model the St. Louis Arch and the Rainbow Bridge in Arizona. They create their models by...
Curated OER
The Kangaroo Conundrum: A Study of a Quadratic Function
Students play a game and collect data for their graph. In this algebra lesson plan, students solve quadratic equations and identify properties of their graph. They describe the pattern created by the graph and the game.
Curated OER
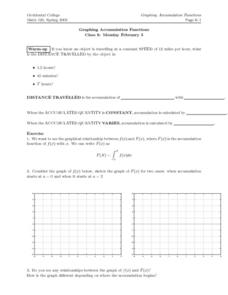
Graphing Accumulation Functions
In this accumulation function worksheet, students find the graphical relationship between two functions. They describe the relationships between the graphs of a function when accumulation begins at 0 and at 2.
Curated OER
Radical Transformations
Students transform the square root function graphically. In this transforming the square root function graphically lesson, students use their Ti-Nspire to change the a, b, and c values of th square root graph. Students transform the...
Curated OER
Guess the Age
Students rewrite word problems using symbols. For this algebra lesson, students rewrite equations graphically, algebraically and verbally. They relate the concepts to the real world.
Curated OER
Price of Apples- Linear Data
Pupils collect data and create a graph. In this algebra lesson plan, students describe functions graphically, algebraically and verbally. They identify functions as being independent and dependent using variables.
Curated OER
The Box Problem
Pupils create graphic, algebraic and verbal ideas of functions. In this algebra lesson plan, students graph functions and identify the zeros of the functions. They find the domain and range and classify functions as relation or not.
Curated OER
Parametric, Vector, Polar, and 3D Functions
Twelfth graders investigate the capabilities of the TI-89. In this calculus lesson, 12th graders explore the parametric equation for a circle, for arc length of curves, and for trajectories. Students investigate the symbolic and...
Curated OER
Atlatl Lesson Grades 4-12
Tenth graders explore the weapons of the Aboriginal people. In this tenth grade mathematics instructional activity, 10th graders investigate how throwing with an atlatl increase the speed of the dart as it is thrown. Students calculate...
Curated OER
Another Way of Factoring
Focusing on this algebra lesson, learners relate quadratic equations in factored form to their solutions and their graph from a number of different aspects. In some problems, one starts with the original equation and finds the solutions....
NTTI
Vectors: Traveling, But in What Direction
High schoolers watch a video of real-world situations regarding speed, direction, velocity, force, etc. and answer questions while viewing. They then practice drawing and using vectors to solve more real-world problems.
Concord Consortium
Functions by the Slice
Piece by piece ... dismantling a function can highlight interesting patterns. The task asks learners to slice functions in sections with the same vertical change. They then recreate the graph with these slices positioned horizontally....
EduGAINs
Introduction to Solving Linear Systems
Word problems offer class members an opportunity to learn the concept of solving linear systems using graphs. Individuals choose a problem based upon preferences, break into groups to discuss solution methods and whether there is...
EngageNY
Probability Distribution of a Discrete Random Variable
Learn how to analyze probability distributions. The sixth installment of a 21-part module teaches pupils to use probability distributions to determine the long-run behavior of a discrete random variable. They create graphs of probability...
EngageNY
Modeling with Exponential Functions
These aren't models made of clay. Young mathematicians model given population data using exponential functions. They consider different models and choose the best one.
Inside Mathematics
Graphs (2007)
Challenge the class to utilize their knowledge of linear and quadratic functions to determine the intersection of the parent quadratic graph and linear proportional graphs. Using the pattern for the solutions, individuals develop a...
EngageNY
Polynomial, Rational, and Radical Relationships
This assessment pair goes way beyond simple graphing, factoring and solving polynomial equations, really forcing learners to investigate the math ideas behind the calculations. Short and to-the-point questions build on one another,...
Mathematics Assessment Project
Maximizing Profits: Selling Boomerangs
You'll return to this resource again .. .and again ... and again. Class members determine the maximum profit of a boomerang-making business by solving a system of equations. They then review and analyze provided sample responses to the...


