Curated OER
Rockefeller's Revenge: Exxon and Mobil Unite
Study the impact and possible outcomes of the Exxon-Mobil merger in your language arts, social studies, or economics class. Secondary learners evaluate a series of graphs, write a paragraph interpreting the data, and engage in class...
Curated OER
Tell Us All: Tools for Integrating Math and Engineering
What a scam! Middle and high schoolers pose as journalists exposing consumer fraud. In this lesson, they write an article for a magazine using data collected during previous investigations (prior lessons) to defend their findings that a...
Curated OER
Math--Pictures and Bars--Learning About Graphs
What is a graph? What does it tell us? How do you make one? These are all questions that are answered in the included packet. It's a great introduction to graphing for young learners!
Curated OER
Misleading Graphs
Students explore number relationships by participating in a data collection activity. In this statistics lesson, students participate in a role-play activitiy in which they own a scrap material storefront that must replenish its stock....
Curated OER
Shaky New Zealand
Students explore geography by answering study questions in class. In this plate tectonics lesson, students identify the earthquake data concerning the country of New Zealand and answer questions regarding the data. Students identify...
Curated OER
Graphing and Analyzing
In this graphing and analyzing worksheet, 9th graders first state if each graph represents a linear or nonlinear relationship. Second, they create a difference table for each set of data presented and determine whether it represents a...
Curated OER
Science: Teddy Bear Nation
Young scholars sort teddy bears according to types and then graph the results. They each bring a bear to class and then discuss their similarities and differences. Once the bears have been sorted into groups according to size and color,...
Curated OER
Investigating: Interpreting Graphs and Analyzing Data
Students explore statistics by researching class birthday data. In this data analysis instructional activity, students investigate the different birthdays among their classmates and create data tables based on the given information....
Curated OER
The Appearance of a Graph
Sixth graders understand that the appearance and increment used on the x and y axis in a graph change how it looks. For this graphing lesson, 6th graders work in pairs and interpret graphs using different axes. Students collect graphs...
Curated OER
Graphing
Students collect data to create different types of graphs-line, pie, and bar graphs. They use StarOffice 6.0 to create graphs.
Curated OER
Human Fingerprints: No Two the Same
Sixth graders explore scientific observations by analyzing a group of data. In this fingerprint identification lesson, 6th graders identify the reasoning behind fingerprinting and create their own ink fingerprints. Students discuss the...
Curated OER
The Night Before Christmas Graph
First graders graph their favorite The Night Before Christmas books. In this graphing lesson students listen to several versions of the the same story, The Night Before Christmas. The students each choose their favorite version and the...
Curated OER
By Golly, By Gum
Learners investigate the ingredients and creation of chewing gum. In this scientific method lesson, students make predictions about what will happen to the mass of a piece of gum as it is chewed by a human. Learners graph the data from...
Curated OER
A Research Project and Article For the Natural Inquirer
Get your class to use the scientific process to solve a scientific problem. They utilize the Natural Inquirer magazine to identify a research question which they write an introduction to and collect data to answer. They use graphs,...
Curated OER
What's Your Favorite? Survey And Graphing Project
Sixth graders create and edit spreadsheet documents using all data types, formulas and functions, and chart information. They collect and organize data that be portrayed in a graph that they create using EXCEL.
Curated OER
Earth Energy Budget Pre Lab
Students explore energy by conducting an in class experiment. In this climate change lesson plan, students conduct a water vapor experiment in a soda bottle. Students utilize graphs and charts to analyze the results of the experiment and...
Curated OER
Different Perspectives of Oregon's Forest Economic Geography
Students map data on employment in wood products manufacturing in Oregon counties. In this Oregon forest instructional activity, students discover the percentage of people employed in the forest manufacturing industry. Students create a...
Curated OER
Different! Diverse! Dynamic! Lesson 1: Late Bloomers
Students examine how people grow and mature at different rates. They create a graph and a timeline to organize the data they collect.
Curated OER
MAISA and the REMC Association of Michigan
Students complete online research to study geography's impact on weather. In this geography and weather lesson, students research weather in their city for ten days using an online website. Students bookmark the site, enter data into a...
Curated OER
Locating the Salt Front - Section 1
In this salt front of the Hudson River learning exercise, 7th graders first read an excerpt about the lower portion of the Hudson River that is an estuary. Then they use a colored pencil to plot salinity data from the table shown on a...
Curated OER
An Inventory of My Traits
In this biology activity, students identify and describe a number of easily observable genetic traits and compare the traits they have with other students. Then they identify and describe that some traits are common while others are not...
Curated OER
Line 'Em Up!
Students find coordinate points on a grid and create a line graph with those points. This lesson should ideally be used during a unit on various types of graphs. They make and use coordinate systems to specify locations and to describe...
Curated OER
Berlioz the Bear
Young children read the story, Berlioz the Bear and complete various reading and writing activities. They learn about fiction and non-fiction, and complete graphing and writing activities for the story. Youngsters draw the bear and use...
Curated OER
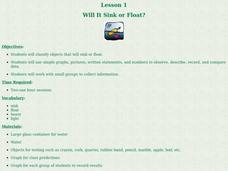
Will It Sink or Float?
Students perform experiments to see if items will sink or float. In this sink or float lesson, students work in groups to make predictions, and record the results. After the experiments are complete students make a book of the results.


