Curated OER
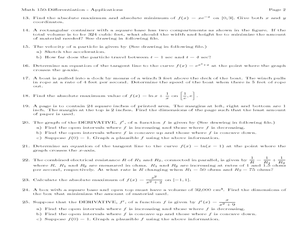
Math 150 - Differentiation Applications
In this differentiation worksheet, students solve 25 short answer word problems. Students solve application word problems by finding the derivatives of functions.
Curated OER
Graphing Statistics & Opinions About Pets
Young scholars explore how to use a double bar graph by polling other students about their feelings and experiences with pets. They also have the opportunity to think about how pets affect their lives. Young scholars poll their...
Curated OER
Logarithmic Differentiation
In this calculus worksheet, 12th graders perform logarithmic differentiation on functions for which the ordinary rules of differentiation do not apply. The one page interactive worksheet contains eleven problems. Answers are included.
Curated OER
Differentiation of Trigonometry Functions
In this trigonometry worksheet, students differentiate the different trigonometric identities. They derive the sine, cosine, tangent and inverses of these trig identities. There are 18 questions with an answer key.
Curated OER
Differentiation Using the Quotient Rule
In this calculus worksheet, students use differentiation to solve problems. They apply the quotient rule as they solve rational expressions. There are 19 questions with an answer key.
EngageNY
Structure in Graphs of Polynomial Functions
Don't allow those polynomial functions to misbehave! Understand the end behavior of a polynomial function based on the degree and leading coefficient. Learners examine the patterns of even and odd degree polynomials and apply them to...
EngageNY
Comparing Linear Functions and Graphs
How can you compare linear functions? The seventh installment of a 12-part module teaches learners how to compare linear functions whose representations are given in different ways. They use real-world functions and interpret features in...
Virginia Department of Education
Scatterplots
Math is all fun and games with this activity! Learners use an activity designed around hula hoops to collect data. They create scatter plots with their data and then analyze the graphs for correlation.
Curated OER
Slope, Vectors, and Wind Pressure
A hands-on lesson using the TI-CBR Motion Detector to provide information to graph and analyze. The class uses this information to calculate the slope of motion graphs and differentiate scalar and vector quantities. There is a real-world...
Curated OER
Busted Bubbles
Using the scientific method, and bubble gum, learners conduct a motivating experiment. After conducting a series of tests involving bubble gum, they graph and analyze their results. This is the type of activity everyone loves.
Curated OER
Counting Coins
Second graders identify a quarter, dime, penny, nickel, and dime. They match the coin with it's monetary value, collect data on excel spreadsheet, and create a graph in Excel. Students participate in group activities.
National Council of Teachers of Mathematics
Stitching Quilts into Coordinate Geometry
Who knew quilting would be so mathematical? Introduce linear equations and graphing while working with the lines of pre-designed quilts. Use the parts of the design to calculate the slope of the linear segments. The project comes with...
Curated OER
Compound Inequalities and Graphing
Put geometry skills to the test! Learners solve compound inequalities and then graph the inequalities on a coordinate plane using their geometric skills. They identify the slope and y-intercept in order to graph correctly. I like this...
Curated OER
Matchstick Math: Using Manipulatives to Model Linear, Quadratic, and Exponential Functions
Playing with matches (unlit, of course) becomes an engaging learning experience in this fun instructional unit. Teach pupils how to apply properties of exponential functions to solve problems. They differentiate between quadratic and...
Curated OER
Introduction to Differentiation
In this introduction to differentiation worksheet, learners solve and complete 10 various types of problems. First, they use the definition of differentiation to evaluate the derivative of the functions listed. Then, students sketch the...
Curated OER
Functions and Differentiation
In this calculus instructional activity, learners identify functions based on different Theorems as it relates to calculus and the Fundamental Theorem. There are 13 questions dealing with differentiation and trigonometric graphs.
Texas Instruments
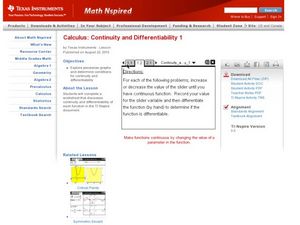
Continuity and Differentiability 1
Pupils examine graphs for continuity and differentiability in this calculus lesson. They observe piecewise functions to see where continuity and differentiability come into play. Learners finish by graphing their equation on the TI...
Curated OER
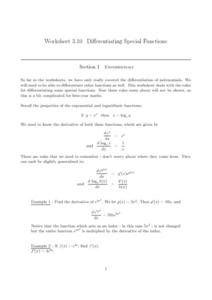
Differentiating Special Functions
In this differentiating special functions worksheet, students solve and complete 5 various types of problems. First, they differentiate each of the given functions. Then, students complete the table using a calculator and plot the points...
Curated OER
Graph Lesson
First graders collect data on different eye colors of each student in their classroom. They input the data that they gathered in an Excel spreadsheet and then create a graph in Excel.
Old Dominion University
Introduction to Calculus
This heady calculus text covers the subjects of differential and integral calculus with rigorous detail, culminating in a chapter of physics and engineering applications. A particular emphasis on classic proof meshes with modern graphs,...
Virginia Department of Education
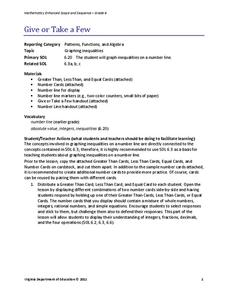
Give or Take a Few
Young mathematicians extend their knowledge of rational numbers on a number line to graph inequalities by first using number cards to compare rational numbers. They finish by using similar reasoning to graph inequalities on a number line.
National Security Agency
Starting a Restaurant
Through an engaging unit, chefs-in-training will sort and classify data using tally charts. Learners will also create bar graphs to display restaurant data and interpret data from bar graphs using a variety of categories. This is a fun...
Balanced Assessment
On Averages and Curves
Determine the average on a curve. The class finds graphical representations of averages and expresses them both symbolically and on the graph. The assessment requires class members to justify using average to describe graphs.
Achieve
Rabbit Food
Keep your pets slim, trim, and healthy using mathematics! Pupils use a linear programming model to optimize the amount and type of food to provide to a pet rabbit. They model constraints by graphing inequalities and use them to analyze a...


