Virginia Department of Education
Determining Direct Variation
Once learners realize what direct variation is, they see it's just a type of linear function. The activity poses a general question that leads to the creation of the y = kx formula. The resource includes discussion prompts and ideas for...
Virginia Department of Education
Types of Variations
Scholars determine how two quantities vary with respect to each other. They complete a fill-in-the-blank activity by stating whether the entities vary directly, inversely, or jointly, create equations that match different variations, and...
Curated OER
Very Varied - Inverse variation
Young scholars identify inverse variations. In this inverse variation instructional activity, students explore graphs and identify the inverse variation. They write equations for the inverse variation. Young scholars compare and...
Curated OER
Graphs of Direct Variation
Students identify graphs for direct variation. In this algebra worksheet, students analyze graphs to determine their direct variation. They also determine whether the graphs are functions or not.
Curated OER
Graphs and Direct Variation
Students solve problems with direct variation. In this algebra lesson, students analyze graphs to figure out the direct variation of a line. They observe the slopes based the steepness of the lines.
02 x 02 Worksheets
Inverse Variation
Discover an inverse variation pattern. A simple lesson plan design allows learners to explore a nonlinear pattern. Scholars analyze a distance, speed, and time relationship through tables and graphs. Eventually, they write an equation to...
CPM
Direct, Joint, and Inverse Variation
Here is a quick guide to direct, joint, and inverse variation used in realistic situations. Each topic has a page of notes and examples followed by practice problems. The resource explains each type of variation and provides their...
Chicago Botanic Garden
Plant Phenology Data Analysis
Beginning in 1851, Thoreau recorded the dates of the first spring blooms in Concord, and this data is helping scientists analyze climate change! The culminating instructional activity in the series of four has pupils graph and analyze...
Curated OER
Regents High School Examination: Living Environment 2007
Environmental science enthusiasts show what they know at the end of the year by taking this full-fledged final exam. They answer multiple choice, graph interpretation, and essay analysys questions, 73 of them in all. Topics range from...
Teach Engineering
Applications of Linear Functions
It's not so straightforward — lines can model a variety of applications. Pupils experience linear relationships within the context of science, including Hooke's and Ohm's Laws. Class members got a taste of motion and speed from the...
Curated OER
Direct, Inverse and Joint Variation
Eleventh graders identify, create and solve word problems involving inverse variation. In this algebra lesson, 11th graders solve problems using direct, inverse and joint variation. They identify problems using these methods.
Curated OER
Jim Murphy, The Great Fire - Grade 6
The Great Fire by Jim Murphy provides the text for a study of the Chicago fire of 1871. The plan is designed as a close reading activity so that all learners have the same background information require for writing. Richly detailed, the...
Curated OER
Consistent Circles
Students create a design of a circle. In this geometry lesson plan, students identify the measure of the diameter and radius of a circle. They graph and analyze their collected data and write equations based on direct variation.
Curated OER
Regents High School Examination: Living Environment 2009
Emerging ecologists need a full understanding of life, from the inner workings of a cell to the complex relationships among organisms. This examination is meant to assess high schoolers after an entire year course on the living...
Teach Engineering
Forms of Linear Equations
Linear equations are all about form. The fifth part in a unit of nine works with the different equivalent forms of linear equations. Class members become familiar with each form by identifying key aspects, graphing, and converting...
Curated OER
Adaptations to Niches and Habitats
Life science learners measure and record traits of seeds, leaves, and their own hands and then graph the data to find a continous distribution curve. They compare and color diagrams of seven different animals' forelimbs (not included),...
Curated OER
Genetic Variations in Hand Span Size
Students study genes. In this biology lesson plan, students measure their handspan size to determine if one pair or many pairs of genes control that trait.
Curated OER
Direct and Inverse Variation
Eighth graders participate in two data collection activities that involve direct and inverse variation. In the pre-assessment, 8th graders categorize numerical, graphical, and verbal representations as linear or nonlinear and determine...
Curated OER
Tides & Lunar Cycles
Students demonstrate how the moon affects the tides, a neap tide, and spring tides by using their bodies as models. After students observe the model they created, they draw and label the diagram on a provided worksheet. They then log...
Workforce Solutions
Miniature Gulf Coast Project
Scholars show what they know about data collection and analysis with an activity that examines a smaller population of Houghton, Texas. Independently or in pairs, learners identify their research question, gather, graph, and analyze...
Curated OER
Do the Elephants Need Sunscreen? A Study of the Weather Patterns in Etosha
Students analyze the weather patterns in Namibia. They create a graph of the yearly temperatures and use the internet to gather information. They discuss how the weather goes in cycles in the area.
Curated OER
Linear Piecewise Functions
Students explore the concept of piecewise functions. In this piecewise functions lesson, students graph piecewise functions by hand and find the domain and range. Students make tables of values given a piecewise function. Students write...
Illustrative Mathematics
Buying Bananas, Assessment Version
Practice with unit rates, proportions, and ratios when Carlos purchases an amount of bananas. Learners must interpret a graph to decide whether points on the same line represent similar proportional relationships. Use with lesson plans...
Curated OER
The Canoe Trip, Variation 2
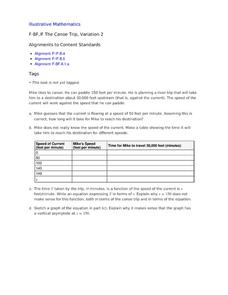
The behavior of a rational function near a vertical asymptote is the focus around this trip up a river. Specifically, numerical and graphical understanding is studied. The canoe context pushes the variables as numbers, rather than as...


