Hi, what do you want to do?
CK-12 Foundation
Graphs for Discrete and for Continuous Data: Discrete vs. Continuous Data
Not all data is the same. Using the interactive, pupils compare data represented in two different ways. The learners develop an understanding of the difference between discrete and continuous data and the different ways to represent each...
Curated OER
Analyzing Discrete and Continuous Data in a Spreadsheet
You are what you eat! Your statisticians keep a log of what they eat from anywhere between a day to more than a week, keeping track of a variety of nutritional information using a spreadsheet. After analyzing their own data, individuals...
Mathematics Vision Project
Module 4: Rational Functions
Time to study the most sensible function — rational functions! The seven-lesson unit develops the concept of a rational function through a connection to rational numbers and fractions. Scholars graph functions, solve equations, and...
Virginia Department of Education
Normal Distributions
Pupils work to find probabilities by using areas under the normal curve. Groups work to calculate z-scores and solve real-world problems using the empirical rule or tables.
Google
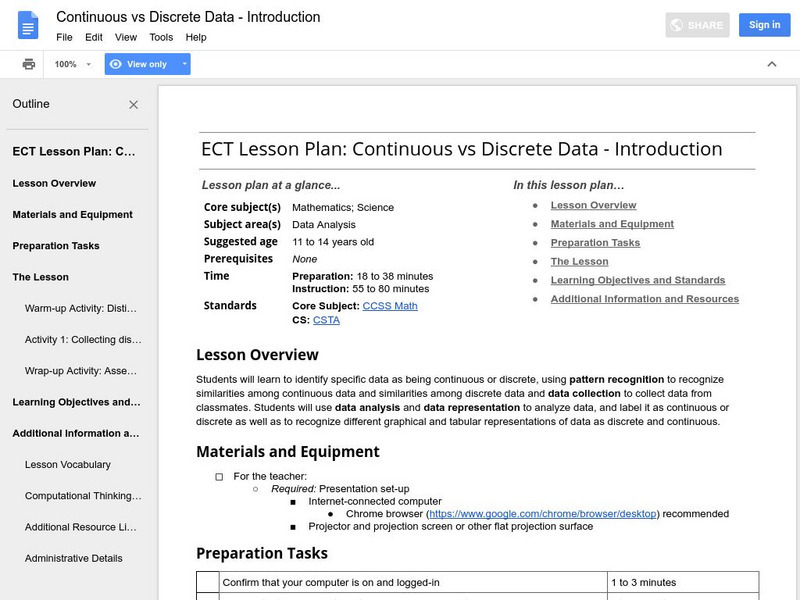
Google for Education: Continuous vs Discrete Data
When working with data, it is important to know whether it is continuous or discrete, as this will determine what calculations can be applied and what information can be extracted from it. Here, students to distinguish between continuous...
Sophia Learning
Sophia: Continuous vs Discrete Data
Explore continuous and discrete data and when to use one over the other.
Sophia Learning
Sophia: Continuous vs Discrete Data
Explore continuous and discrete data and determine when to use each one.


