Virginia Department of Education
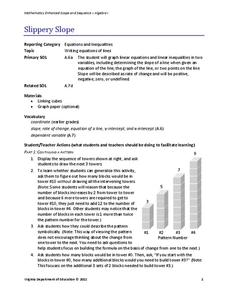
Slippery Slope
Explore slope using geometric patterns. Young mathematicians investigate towers built from cubes to develop a linear pattern. They move the data to a coordinate plane to connect the pattern to slopes.
Curated OER
String Of Lights
Students collect, graph and analyze data. In this statistics lesson, students compare data using different types of graphs. They make predictions, draw conjectures as they analyze bulbs used in a holiday light set.
Curated OER
Grade Data Analysis and Probability
Eighth graders display the outcome of given events by creating and reading tree diagram. They explain the relationship between addition and multiplication.
Curated OER
Surveys
Students collect data from middle school survery. They tabulate percentages by grade level. They create a graph to display the survey results.
Curated OER
Exploring Linear Equations And Scatter Plots - Chapter 5 Review
Students complete rolling stocks experiment, and collect and enter data on the computer. They enter data on graphing calculators, complete scatter plot by hand with line of best fit, and discuss different graphing methods.
Curated OER
Climate Change
Students compare weather data and draw conclusions. For this climate change lesson plan, students determine whether data collected over a period of ninety years shows a warming trend.
Curated OER
Graphing Favorite Fruit
Third graders take poll and sort data, enter the data to create a spreadsheet and create bar and pie graphs.
Alabama Learning Exchange
Inch by Inch
Third graders listen to a read-aloud of Leo Lionni's, Inch by Inch before measuring a variety of items using both standard and metric units. They record the measurement data and follow a recipe for dirt pie.
Curated OER
Tall Tale Rollers
Students explore American tall tales. In this tall tale lesson, students discover the six characteristics that are included in tall tales. Students survey their class to find each student's favorite tall tale character and organize the...
Curated OER
Water, Water Everywhere
Students monitor a local creek. In this environmental water lesson, students conduct an environmental study of a local creek by monitoring the temperature and water quality over a period of time, then submit data to the Global Water...
Curated OER
Who's got the fastest legs?
Students use a stopwatch to collect information for a scatterplot. For this fastest legs lessons, students collect data through the taking of measurements, create and find a median number. Students develop an equation and...
Curated OER
Fast Food Survey Using Bar Graphs
Second graders create a bar graph to pictorically represent the data collected from a survey of students. They use Excel to electronically create the graphs and data tallies. They then interpret their data using sentences to explain.
Curated OER
The Demise of the Great American Frontier
Learners are introduced to Frederick Jackson Turner and how early Census data, when combined visually with maps, effectively demonstrated the end of the frontier.
Curated OER
Hi, Deer!
Students collect, organize by table, and examine census data in a simulation, estimate the size of the population in the simulation and make predictions based on the collection of census simulation data.
Curated OER
Names Count!
Second graders work in small groups to complete a graph and use data to determine range, mode, and median. They use the number of letters in their names and in fairy tale characters names to produce their data. This is a fun activity!
Curated OER
Pika Chew
Learners work in collaborative teams with specific roles, use the Internet to research the behavior and ecology of pikas, make predictions about survival rates of pikas in different habitats and organize their data in graphs.
Curated OER
Body Voyager
Students explore the significance of a resting and an active heart rate. In this heart lesson students chart data on their pulse and draw a diagram of the heart.
EngageNY
Relationships Between Two Numerical Variables
Working in small groups and in pairs, classmates build an understanding of what types of relationships can be used to model individual scatter plots. The nonlinear scatter plots in this activity on relationships between two numerical...
Baylor College
Needs of Plants
What better way to learn about plant life than by creating a class garden? Young botanists start with a brief discussion about radishes before planting seeds and watching them grow. To determine the importance of water,...
University of Georgia
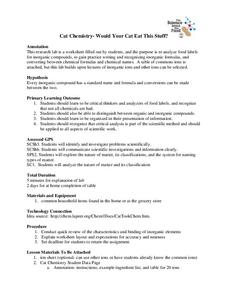
Would Your Cat Eat This Stuff?
Processed foods use inorganic compounds for flavoring and preservation. This take-home laboratory challenges scholars to find 20 different compounds identified on the labels of foods to list on their data collection sheet. The activity...
Curated OER
A Picture is Worth a Thousand Words: Introduction to Graphing
Students practice graphing activities. In this graphing lesson, students discuss ways to collect data and complete survey activities. Students visit a table and graphs website and then a create a graph website to practice graphing.
Curated OER
Virtual Field Trip
This hands-on resource has future trip planners analyze graphs of mileage, gasoline costs, and travel time on different routes. While this was originally designed for a problem-solving exercise using a Michigan map, it could be used as a...
Curated OER
Young Voters Make A Difference
Students research recent statistics on voting by those 18 to 24. They survey senior students to determine their intent to vote in the next election. Students display the data in charts and graphs. They write the results and share it with...
Curated OER
Bird Feeding and Migration Observation
Students research bird migration and build a bird house. In this bird lesson plan, students research the birds in their area and where they migrate to. They also build their own bird house and record data on what kinds of birds come to...
Other popular searches
- Data Display
- Misleading Data Display
- Appropriate Data Display
- Graphs and Data Display
- Data Display Center
- Voluntary Data Display
- Best Data Display
- Data Display and Analysis
- Rates and Data Display
- Simulation Data Display
- Ways to Display Data
- And Display Simple Data
