Curated OER
Reading Graphs
Working independently or in teams, your class practices connecting graphs, formulas and words. This activity includes a guided discussion about distance vs. time graphs and looking at how velocity changes over time.
Curated OER
Worksheet 3: Graphing Speed and Time
In this graphing speed and time worksheet, students answer 7 questions regarding graphing, speed, distance, derivatives, Newton's method and wheel radius.
Illustrative Mathematics
Velocity vs. Distance
At the end of this activity, your number crunchers will have a better understanding as to how to describe graphs of velocity versus time and distance versus time. It is easy for learners to misinterpret graphs of velocity, so have them...
Teach Engineering
Matching the Motion
It is not always easy to walk the straight and narrow. In the sixth portion of a nine-part unit, groups actively recreate a graph depicting motion. Individuals walk toward or away from a motion detector while trying to match a given...
Curated OER
Motion of a Bowling Ball
Students experiment with distance, speed, and motion by graphing the motion of a bowling ball. In this distance versus time graphing lesson, students observe the speed and distance of a rolling ball and graph their findings. They then...
Edmond Public Schools
8th Grade Science Resource Book: Unit 2 - Physics
Get things moving with this extensive collection of physical science resources. Covering the fundamentals of measurement, graphing, lab safety, and experimental design as well as the specific scientific concepts of velocity,...
Curated OER
Understanding Distance, Speed, and Time Relationships
Students investigate distance, speed, and time relationships. In this distance, speed, and time relationships lesson, students simulate a runner using a computer program. Students adjust the starting point and speed of the runner and...
EngageNY
Graphs of Piecewise Linear Functions
Everybody loves video day! Grab your class's attention with this well-designed and engaging resource about graphing. The video introduces a scenario that will be graphed with a piecewise function, then makes a connection to domain...
Curated OER
Graph Your Motion
Learners graph their linear equations. In this algebra lesson, students examine their lines and relate it to the slope or rate of change. They relate the steepness of the line to the slope being positive, negative or zero.
Houston Area Calculus Teachers
Collecting Driving Data
Give AP Calculus classes the opportunity to check the accuracy of their calculations! A calculus activity involves the collection of data, the application of mathematics, and the analysis of the accuracy of results. Young mathematicians...
Curated OER
Hit and Run
Pupils explore data collection in this lesson. They investigate distance vs. time and velocity vs. time graphs using information collected with a CBR 2 to simulate the reconstruction of an accident.
Curated OER
Worksheet 1 - Equation of a Line
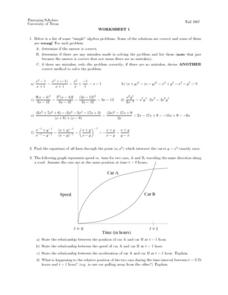
In this equation of a line worksheet, students determine the equation of a line, use the distance formula to identify the relationship between two moving objects, and solve inequalities algebraically. This two-page worksheet contains...
Mathalicious
The Fall of Javert
Falling off a bridge might not sound like your idea of a good math problem, but incorporating the final scene of Les Misérables is sure to spark interest. The goal is to use the time Javert fell off the bridge to determine how high he...
Curated OER
CEEnBoT Stories
Students identify the slope of a line as negative, positive, zero or undefined. In this algebra lesson, students identify the distance versus the time using graphs of linear equation. They use the robot and the CEENBoT program to analyze...
Curated OER
Faster speed-Shorter Time
Young scholars calculate the inverse variation, and speed given the formulas. In this algebra lesson, students investigate properties of conics, focusing on the hyperbola. They identify the distance between the directrix and other parts...
Curated OER
You Drive Me crazy
Students calculate the distance and acceleration of an object. In this algebra lesson, students collect data and create table and graphs to analyze it. They complete a lab as they collect and analyze data on acceleration and distance.
Curated OER
Discovering Pi/Welcome to Pi Day
Students explore pi. In this circle measurement lesson, students define and identify radius, diameter, circumference, and perimeter. Students work in groups to measure several plastic lids and record their findings. Students compare the...
Curated OER
Measurement
Students choose appropriate units of measure and predict length using the metric system. In this measurement instructional activity, students participate in activities in which they predict, measure, and record linear measurements such...
Curated OER
Race The Rapper: Slopes
Students calculate the slope of the equation For this algebra lesson, students graph coordinate pairs of linear equations and identify the relationship between x and y values and slope. They differentiate between functions and...
Curated OER
Velocity
For this pre-calculus worksheet, students calculate the velocity of a linear graph by observing the slope of a line. There are 10 velocity questions.
Curated OER
The Webb Space Telescope: Detecting Dwarf Planets
In this detecting dwarf planets worksheet, learners read about the Webb Space Telescope that will be launched in 2014 to detect dwarf planets using an infrared telescope. Students solve 3 problems and create a graph for each using given...
Curated OER
La Toteca- A Tropical Paradise
Students collect data on the time of the ferry. In this algebra lesson, students use the data to predict a ferry schedule. They also compute the depth where oxygen would be needed when diving.
Curated OER
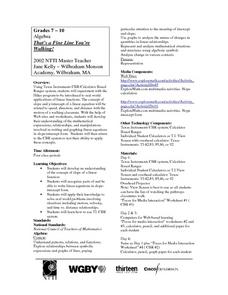
That's a Fine Line You're Walking!
Young scholars experiment with Hiker program to practice real world applications of linear functions and develop their understanding of expressions, relationships, and manipulations involved in writing and graphing linear equations in...
Curated OER
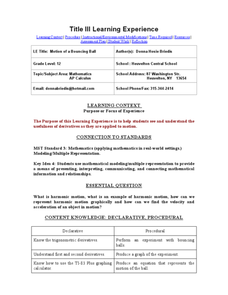
Motion of a Bouncing Ball
Twelfth graders complete a unit of lessons on derivatives as they are applied to motion. They observe and discuss demonstrations, conduct an experiment involving a motion sensor, graph and analyze the results, and summarize their findings.


