Curated OER
Number Dot to Dot
In this connecting the numbers worksheet, students draw lines in numbers sequence from one to fifteen to create a picture. Students connect 14 dots.
Curated OER
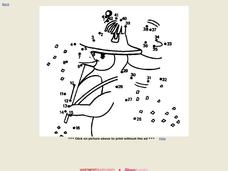
Numbers Dot to Dot
In this numbers dot to dot worksheet, students draw lines from 1 to 44 to complete a picture. In this drawing worksheet, students create one picture.
Curated OER
Numbers Dot to Dot 1 23
In this numbers dot to dot activity, students draw lines from number 1 to 23. In this drawing activity, students complete one picture.
Curated OER
Dot-to-dot Rock Multiplication
In this dot-to-dot rock multiplication worksheet, 3rd graders solve 12 problems for the facts of 9, then connect the dots in order of the products to reveal the mystery picture.
Curated OER
Numbers Dot to Dot 1 42
In this numbers dot to dot worksheet, students draw lines from 1 to 42 to complete a picture. In this drawing worksheet, students complete one picture.
Curated OER
Sunscreen Dot to Dot - Work Backwards From 21
In this number recognition and health worksheet, students connect the dots to find a bottle of sunscreen. They start at the number 21 and work backwards to 1 as they form the bottle.
Curated OER
ABC Dot to Dot
In this alphabetical order worksheet, students complete a dot to dot. Students connect all 26 letters of the alphabet, creating a flower upon completion.
Curated OER
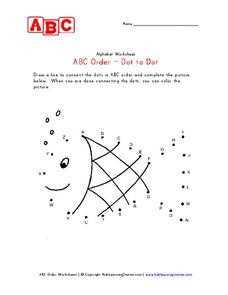
ABC Order- Dot to Dot
In this alphabet worksheet, students draw a line to connect the dots in ABC order to complete the picture. Students color in the picture when they are done.
Curated OER
Apple Basket Dot to Dot - Skip Counting by 5 's
In this skip counting learning exercise, 2nd graders complete a dot to dot puzzle. They start at the number 5 and follow the dots by skip counting by 5's to 100. They complete a picture of an apple basket.
Curated OER
Dot-to-Dot Puzzle- Numbers 1-47
In this dot-to-dot puzzle, 2nd graders start at the number one and continue drawing lines between the numbers until the finish at the number forty-seven. They draw a teddy bear by completing the puzzle.
Curated OER
Teddy Bear Dot to Dot
In this teddy bear dot-to-dot worksheet, students trace the numbers beginning with 1 and ending with 35 to form the picture of a teddy bear.
Curated OER
Numbers Dot to Dot 1 41
In this numbers dot to dot worksheet, students draw from number one to number 41. In this drawing worksheet, students complete one picture.
Curated OER
Jack O Lantern Dot to Dot Activity
In this Halloween worksheet, students complete a dot to dot Jack O Lantern puzzle by starting at the number 1 and following through to the number 24. They count the numbers as they complete the picture.
Curated OER
r and n
Here is some kid-friendly practice with the letters r and n that will ignite your scholars' artistic sides. They connect the dots to trace the lowercase letters before copying them in the space provided. There are two...
EngageNY
Displaying a Data Distribution
Pupils analyze a display of data and review dot plots to make general observations about the highest, lowest, common, and the center of the data. To finish, learners match dot plots to scenarios.
Curated OER
What Shapes Can You See?
This clown is missing some things, and young counters sequence single-digit numbers to complete this juggling act. They connect four separate connect-the-dots sequences to create two triangles and two squares, then complete three more...
EngageNY
Connecting Graphical Representations and Numerical Summaries
Which graph belongs to which summary statistics? Class members build upon their knowledge of data displays and numerical summaries to connect the two. Pupils make connections between different graphical displays of the same data in...
EngageNY
Describing Distributions Using the Mean and MAD
What city has the most consistent temperatures? Pupils use the mean and mean absolute deviation to describe various data sets including the average temperature in several cities. The 10th lesson in the 22-part series asks learners to...
EngageNY
Understanding Box Plots
Scholars apply the concepts of box plots and dot plots to summarize and describe data distributions. They use the data displays to compare sets of data and determine numerical summaries.
EngageNY
Summarizing a Distribution Using a Box Plot
Place the data in a box. Pupils experiment with placing dividers within a data set and discover a need for a systematic method to group the data. The 14th activity in a series of 22 outlines the procedure for making a box plot based...
Willow Tree
Line Plots
You can't see patterns in a jumble of numbers ... so organize them! Learners take a set of data and use a line plot to organize the numbers. From the line plot, they find minimum, maximum, mean, and make other conclusions about the...
Oregon Department of Education
Building Number Sense
It's never too early to begin a child's math education. This collection of fun hands-on activities engage youngsters in building their number sense as they learn how to count objects, identify numerals, compare amounts, and much more.
BBC
Walking with Dinosaurs
Breath new life into your class's study of dinosaurs with this extensive collection of materials. Offering everything from a printable T-rex mask, word searches, and connect-the-dots activities to informational handouts, hands-on...
EngageNY
Describing Distributions Using the Mean and MAD II
The 11th lesson plan in the series of 22 is similar to the preceding lesson plan, but requires scholars to compare distributions using the mean and mean absolute deviation. Pupils use the information to make a determination on which data...
Other popular searches
- Dot to Dot Worksheets
- Dot to Dot Puzzle
- Alphabet Dot to Dot
- Dot to Dot Picture
- Halloween Dot to Dot Picture
- Dinosaur Dot to Dot
- Duck Dot to Dot
- Dot to Dot 1 30
- Cat Dot to Dot
- Number Dot to Dot
- Dot to Dot Fish
- Dot to Dot Heroes


