Curated OER
Drawing Conclusions and Comparing/Contrasting - The Everglades
Students complete activities to compare, contrast, and draw conclusions for a instructional activity about the Florida Everglades. In this drawing conclusions instructional activity, students watch videos about a scientists study of pig...
Curated OER
Recognizing Litter
When does trash become litter? Use this litter awareness lesson to help them understand the importance of trash disposal. Get learners engaged by reading Nancy Loewen's Lady Lulu Liked to Litter (not included). After discussing what...
Curated OER
Speed
Fifth and sixth graders practice working in pairs to determine whether they can walk with constant speed. They test themselves, collect their data, draw graphs with their data collected, manipulate the data, and then draw conclusions...
Curated OER
Reel Projects
Students investigate projectile motion. In this projectile motion lesson, students investigate a website with an interactive lesson. Students view the changes in the projectile they see in the lesson. Students watch short video clips and...
Howard Hughes Medical Institute
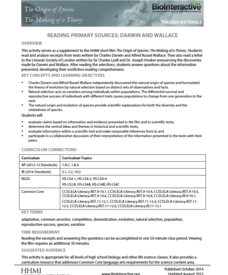
Reading Primary Sources: Darwin and Wallace
Take your classes back in time. Learners read real historical texts from both Darwin and Wallace as well as an announcement of their findings. Using guiding questions, they make inferences and draw conclusions from the information in the...
Baylor College
Body Mass Index (BMI)
How do you calculate your Body Mass Index, and why is this information a valuable indicator of health? Class members discover not only what BMI is and practice calculating it using the height and weight of six fictitious individuals, but...
Learning Games Lab
The Magic of Reading Graphs
Making conclusions from graphs doesn't need to seem like magic. Learners explore an interactive lesson on reading graphs to strengthen their skills. The content discusses how to read the axes of a graph and draw conclusions based on the...
Beyond Benign
Plastic Bags
Paper or plastic? Explore the environmental effects of using plastic bags through mathematics. Learners manipulate worldwide data on plastic bag consumption to draw conclusions.
Curated OER
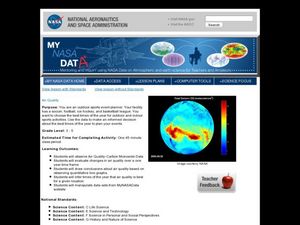
Air Quality
Students observe air quality and monoxide data. In this air quality lesson plan, students draw conclusions and manipulate data from a one year period on changes in air quality.
Curated OER
Fish Communities in the Hudson
Learning to read data tables is an important skill. Use this resource for your third, fourth, or fifth graders. Learners will will study tables of fish collection data to draw conclusions. The data is based on fish environments in the...
Science 4 Inquiry
An Investigative Look at Florida's Sinkholes
In May of 1981, the Winter Park Sinkhole in Florida first appeared and is now referred to as Lake Rose. Scholars learn about the causes of sinkholes through an inquiry project. Then, they analyze recent data and draw conclusions to...
NOAA
Mud is Mud...or is it?
We know that the type of soil varies by location, but does the seafloor sediment also vary, or is it all the same? Scholars compare photos of the seafloor from two different locations: the Savannah Scarp and the Charleston Bump. Through...
Curated OER
Germs and the Importance of Washing Your Hands
Students observe what happens when bread is handled by dirty hands. They read and discuss the book "Germs." Students participate in an experiment. Students touch bread with a variation of hands: dirty, washed with soap and water, washed...
Curated OER
Wind Effects- A Case Study
Students explore hurricanes. In this weather data interpretation lesson, students draw conclusions about the impact of Hurricane Floyd as it related to weather conditions. Students read and interpret a tide data table, a barometric...
American Museum of Natural History
What's the Big Deal About Paleontology?
Paleontologists could be considered detectives of the past. A quick online lesson describes the science of paleontology and the importance of fossils. Young scientists read about how paleontologists analyze the features of fossils to...
Purdue University
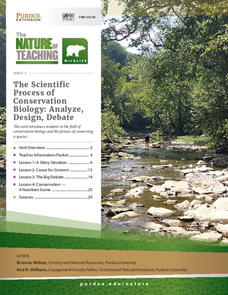
The Scientific Process of Conservation Biology: Analyze, Design, Debate
Scientists use data to learn about species survival—and your classes can too! A set of four lessons guides learners through a process to draw conclusions about the fluctuations in the population of the Hellbender species. They read...
Curated OER
Comparing Temperatures and Latitudes
Eighth graders collect weather data from a variety of cities at the same latitudes, but on different continents. They organize data using spreadsheet program, generate graphs, and incorporate into a word processing document. Students...
Curated OER
Legend of The Lorax
Students explore ecosystems. They read or listen to Dr. Seuss' The Lorax to draw conclusions and make predictions about the environmental impact and use of resources. They write poems about real forests and the wildlife which inhabit...
Curated OER
Greenhouse Effect ...Building Our Own
Learners explore the greenhouse effect. They set up a simplified model of the earth and the greenhouse effect. Students compare temperatures inside a jar to temperatures outside the jar. Pupils collect information and create a line...
Redefining Progress
Have and Have-Not
Is there a correlation between a country's wealth and the extent of its ecological footprint? What exactly constitutes an ecological footprint, and how does one country stack up against the rest? This is a unique instructional activity...
Texas State Energy Conservation Office
Investigation: Kinetic and Potential Energy
A well-developed lab sheet guides physical science learners through an investigation of kinetic and potential energy. In small groups, collaborators discover whether or not the ramp height or mass of an object has an effect on the...
Curated OER
Paper Airplanes and Scientific Methods
In this scientific method and paper airplanes instructional activity, students go through the steps of the scientific method to determine which paper airplane design is best. They complete 8 steps of the scientific method including...
Curated OER
Where's The Beef
Students create and conduct a survey in the community to evaluate the demographics of vegetarians in the community. They compile data, create graphs, calculate percentages, and draw conclusions about the survey data. Students create an...
Curated OER
Why is The Sky Blue?
Learners explore why the sky is blue. In this light lesson, students conduct an experiment using water, flashlights, and milk to test why the sky is blue. Learners view a PowerPoint, take notes on their results and draw conclusions.


