Curated OER
Using Random Sampling to Draw Inferences
Emerging statisticians develop the ability to make inferences from sample data while also working on proportional relationships in general. Here, young learners examine samples for bias, and then use random samples to make...
August House
Anansi Goes to Lunch - Kindergarten
Greed is the theme of the West African folktale, Anansi Goes to Lunch and this multidisciplinary collection of lessons. First, scholars listen to a read aloud and participate in a grand conversation about the book's key details and...
Curated OER
Fish Communities in the Hudson
Learning to read data tables is an important skill. Use this resource for your third, fourth, or fifth graders. Learners will will study tables of fish collection data to draw conclusions. The data is based on fish environments in the...
Balanced Assessment
Movie Survey
Movie preferences will get your classes talking! Individuals read a pie graph and construct a bar graph using the same information. They then answer questions specific to the data and sample size.
Inside Mathematics
Scatter Diagram
It is positive that how one performs on the first test relates to their performance on the second test. The three-question assessment has class members read and analyze a scatter plot of test scores. They must determine whether...
Inside Mathematics
House Prices
Mortgages, payments, and wages correlate with each other. The short assessment presents scatter plots for young mathematicians to interpret. Class members interpret the scatter plots of price versus payment and wage versus payment for...
Curated OER
Zoom Out
Students explore visual perception and how objects change as distance changes. In this distance and vision instructional activity, students practice their scientific inquiry skills. Students practice drawing objects from different points...
Noyce Foundation
Ducklings
The class gets their mean and median all in a row with an assessment task that uses a population of ducklings to work with data displays and measures of central tendency. Pupils create a frequency chart and calculate the mean and median....
Curated OER
M & M Madness
M&M's are always a great manipulative to use when teaching math. In this graphing lesson plan, learners predict how many of each color of M & M's there are. They count up each color and plug the data into a graph using the...
Curated OER
Data
Students collect data from an experiment they perform. In this data lesson, students use multiple representations to solve practical problems; describe advantages and disadvantages of the use of each representation. Then, they evaluate...
Curated OER
Plotting Wind Speed and Altitude
Learners construct, read and interpret tables, charts and graphs. They draw inferences and develop convincing arguments that are based on data analysis. They create a graph displaying altitude versus wind speed.
Curated OER
Teaching and Learning Through Objects
Students identify and interpret the function, usefulness or utitlity, form, beauty or aesthetics, and meaning, context or story, of objects and how they learn new skills and make things that they learn traditionally, by observation and...
Curated OER
M & M Madness
Students work with the mathematics unit of collection, organization, and presentation of data. In this math and technology lesson plan, students use Valentine M & M’s and The Graph Club to sort and graph the various colored M & M’s.
Curated OER
Picking Pythagoras
Students discover that side measurement is used in determining angle classification of a triangle. By squaring sides, they predict whether triangles be right, obtuse, or acute. They prove the Pythagorean Theorem and use it to solve...
Curated OER
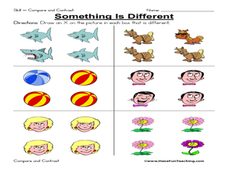
Something is Different: Same/Different
In this different/same worksheet, student draw an X on the picture in a box that is different from the others, 6 sets total. A reference web site is given for additional activities.
EngageNY
Using Sample Data to Compare the Means of Two or More Populations
Determine whether there is a difference between two grades. Teams generate random samples of two grade levels of individuals. Groups use the mean absolute deviation to determine whether there is a meaningful difference between the...
Curated OER
The Dog Days of Data
Students practice an alternative form of data presentation. They practice sequencing data, identifying the stem-and-leaf, creating stem-and-leaf plots, and drawing inferences from the data by viewing the plots.
Curated OER
The Dog Days of Data
Students are introduced to the organization of data This lesson is designed using stem and leaf plots. After gather data, they create a visual representation of their data through the use of a stem and leaf plot. Students
drawing...
Curated OER
M & M Madness
Second graders graph M & M's by color. In this graphing lesson plan, 2nd graders first predict how many of each color they think are in a handful of M & M's. Then they graph the amounts of each color on a computer program....
Curated OER
Jellybean Graphs
Second graders predict and graph data based on the color of jelly beans they think are in a handful. In this prediction lesson plan, 2nd graders will predict how many of each color jellybean are in a handful. Then they graph these...
Curated OER
Saving Money Through Mathematics
Third graders discuss light sources and collect data about energy sources. They compare data and create a multiple line graph showing energy used by light sources for each student in the group. They present their graphs and write a...
Curated OER
Fly, Fly Away
Students use materials from their own environment to design a kite. For this kite design lesson, students research the history of kites and obtain a formal mathematical definition of a kite. Students sketch kite designs after discovering...
Curated OER
Our Favorites
Pupils participate in and conduct a survey to determine various class favorites. They collect, organize and display their data, interpret the results, and complete a packet of worksheets to display the information.
Curated OER
Are You Thirsty? The Effects of Pollution on Drinking Water
Discuss the availability of clean, plentiful water and the causes of water pollution. In groups, sixth graders discuss problem-solving methods for keeping water clean. They explore the function of water treatment plants and perform...


