Curated OER
Coming to America: U.S. Immigration
Analyze primary source documents relating the conditions under with prompted American immigration. Learners will analyze information in order to create a six-panel pamphlet. Much of the lesson is not available but the key objectives are....
Curated OER
SUNSPOTS SPOTTED
Students study sunspots and their motion, from data gathered, they determine the significance of the sunspot data. The data be used to calculate the rotational period of the sun. They draw conclusions as to the sunspot's impact on the...
Curated OER
What Are Erosion and Sediments?
Students create experiments in class based on the erosion of Earth. In this erosion lesson, students perform a lab in class replicating the effects of erosion. Students finally draw their own conclusions based on the research performed.
Curated OER
Designing a Speedometer
In this algebra worksheet, students analyze the designs of a speedometer. They collect data on the distance and time as the speedometer works. They draw conclusion and make predictions from the collected data. There are 4 word problems.
Curated OER
Cloudy vs. Clear
Students analyze line plots. For this weather lesson using real NASA data, students discuss how weather affects the way the Earth is heated by comparing different line plots.
Curated OER
Human Effect
Students investigate changes in air quality. In this science lesson, students compare data to determine the air quality. Students explore how humans affect the air quality.
Curated OER
Monster Graph Activity
Seventh graders engage in a lesson which take the fear out of graphing. They create and draw conclusions from data found in a Monster graph.
Curated OER
Microbes That Are Your Buddies - Biology Teaching Thesis
Students analyze experimental data and draw conclusions. They are able to comprehend that not all microbes are harmful--they can be helpful to humans. Students are able to comprehend specific examples of cases in which microbes are...
Curated OER
Galaxy Hunter - A Cosmic Photo Safari
Space science stars journey through our night sky and take virtual photos of galaxies to investigate simple random samples. Higher math is used to analyze the data collected. Copy the evaluation/assessment questions onto a handout...
Inside Mathematics
Vencent's Graphs
I like algebra, but graphing is where I draw the line! Worksheet includes three multiple-part questions on interpreting and drawing line graphs. It focuses on the abstract where neither axis has numbers written in, though both are...
California Education Partners
Animals of Rhomaar
Investigate the growth rates of alien animals. Pupils study fictional animals from another planet to determine how much they grow per year. The investigators plot the growth of their animals over a period of time and then compare...
Curated OER
Unexpected Answers
Learners explore and complete a variety of activities demonstration probability. They make observations about the results of the activities. Students complete and discuss conditional probability. Also, learners draw conclusions about...
Curated OER
Friction and Inertia
Students study friction and inertia, make predictions, and compare data. In this investigative lesson students view a demonstration on friction, divide into groups, and complete an activity.
Curated OER
Farmers, the Populist Party, and Mississippi (1870-1900)
Students determine the cause and effect of a historical event. They draw conclusions about statistical data and maps and compose a campaign speech for a Populist candidate. They design a political poster and badge for the Populist Party.
Curated OER
Respect--The Data: A Closer Look
Students explore the steps in the scientific method process. In this science lesson, students identify warning signs that someone is in an abusive dating relationship. They evaluate the credibility of information sources.
Curated OER
What is That White Stuff?
Fifth graders identify, through experimentation, what properties of substance are, determine what variables tested will be, identify constants and variables of experiment, conduct experiment to conclusion with measurable, recorded...
Curated OER
Graphs
Students explore graphs and define the different ways they are used to display data. In this algebra activity, students collect data and plot their data using the correct graph. They draw conclusions from their graphs based on their data.
Curated OER
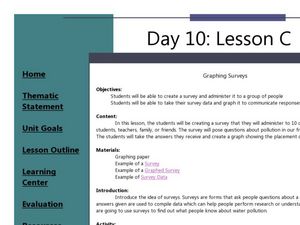
Graphing Surveys
Learners collect data and graph it. In this algebra lesson, students create a survey for their classmates and teachers. They analyze the results from the survey and graph it. They draw conclusion from their data based on the graph.
Curated OER
Height versus Shoe Size
Middle schoolers find a correlation between a person's height and his/her shoe size. They have access to entering data into lists on a graphing calculator and can complete scatter plots. Students read and interpret a scatter plot and use...
Wake Forest University
Authentic Activities for Connecting Mathematics to the Real World
Check out the handout from a presentation that contains a collection of high school algebra projects connecting a variety of mathematics to the real world. Activities range from simple probabilities to calculus. The activities...
Curated OER
The African Slave Trade: From West Africa to South Carolina and Beyond
Eighth graders explore the African slave trade. They identify the principal figures practicing the African slave trades at three locations. Students draw the physical routes of the slave trade on a map and they list the reasons for the...
Curated OER
McCadam's Quarterly Report
Fourth graders problem solve a problem from a local business using data, generating graphs, and draw conclusions. They submit their findings in a business letter format with feed back from a company's plant manager.
Kenan Fellows
Lego Thinking and Building
Run a simulated airplane manufacturing plant with your pupils as the builders! Learners build Lego airplane models and collect data on the rate of production, comparing the number produced to the number defective. Using linear...
Curated OER
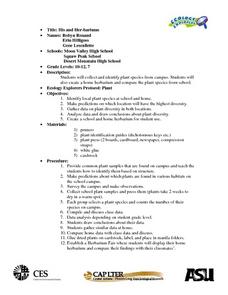
Science: Her-bariums Galore!
Learners collect and identify plant species and construct herbariums both at school and at home. By gathering data from both locales, they draw conclusions and make predictions about plant diversity. Upon completion of the exercises,...


