Curated OER
What Makes The Good Life
What makes a good life? What makes life hard? Get your class thinking about the global picture with this extensive packet. They read quotes from around the world, analyze statistical data from every continent, then read and answer...
Curated OER
Understanding the Bush Tax Cut Plan
The class examines the new tax cut plan proposed by President Bush. They practice calculating income tax rates and interpreting the data. Then they research topics that are of interest to them related to taxes.
Curated OER
Market Failures
Market failure and the effects it has in terms of social benefit is the focus of this eight-page packet. Perfect for homework, this set of excellent worksheets provides several scenarios and graphs that show positive and negative...
Curated OER
Building Data
Students collect census data to help them determine where to build a new supply superstore.
Alabama Learning Exchange
I Know What You Did Last Summer: A Data Graphing Project
Young scholars participate in graphing data. In this graphing data lesson, students make a stem and leaf plot of their summer activities. Young scholars create numerous graphs on poster boards. Students discuss the differences between...
Museum of Tolerance
Why is This True?
Are wages based on race? On gender? Class members research wages for workers according to race and gender, create graphs and charts of their data, and compute differences by percentages. They then share their findings with adults and...
iCivics
Step 7: Fill the Holes
It's time to communicate without using emojis or hashtags! In the seventh step of a 10-part County Solutions - High School unit scholars analyze professional communication when accomplishing a goal. They use examples, research, and data...
Curated OER
How Do You Read Stock Quotes Online ?
Young scholars explore how to get and interpret stock price data online. They also describe certain aspects of various corporations and know the meanings of important terms involving the stock market.
World History Digital Education Foundation, Inc.
COVID-19: Geographic Diffusion
An intriguing instructional activity provides information to help academics understand the role of geography in the diffusion of the COVID-19 illness. Academics interpret charts and make predictions for the future. The timely resource...
Curated OER
Price Elasticity of Demand
A series of economic activities should keep your class busy for a while. Six different worksheets review the concepts of price elasticity, demand, and U.S. economics. Multiple real-world applications and scenarios house each of the ten...
Curated OER
Equilibrium
Twelfth graders and college students alike work on great practical application problems related to supply and demand with this worksheet series. There are five different worksheets containing graphs, charts, and scenario based problems...
Constitutional Rights Foundation
Unemployment and the Future of Jobs in America
Unemployment: The job of the future. The resource, designed for high school scholars, explains unemployment rates, recessions, and job trends that are impacting employment in the United States. Academics explore potential careers of the...
Curated OER
Collecting My School Family Data
Pupils are tasked with collecting data on their school. In groups, they collect data on various aspects of school life along with social and economic backgrounds and charactertics of their hair and eye color. They draw two pictures,...
Curated OER
Ocean Temperatures
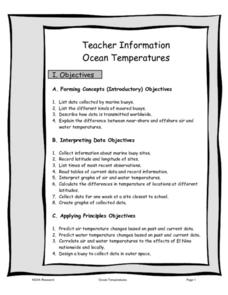
Students list data collected by marine buoys and the different kinds of moored buoys. They describe how data is transmitted worldwide. They explain the difference between near shore and offshore air and water temperatures.
Curated OER
Role-Playing Jean Talon
Pupils explore New France. In this New France activity, students examine census data compiled by Jean Talon in 1665 and 1666. Pupils take on the role of Talon trying to convince the King of France to increase his investment in New France.
Curated OER
Different Perspectives of Oregon's Forest Economic Geography
Young scholars map data on employment in wood products manufacturing in Oregon counties. In this Oregon forest lesson, students discover the percentage of people employed in the forest manufacturing industry. Young scholars create a box...
Curated OER
Integrating Gandhian Principles of Communal Unity in Mathematics
Fourth through sixth graders incorporate Gandhian principles into Math curriculum. They explore Gandhi's teachings on communal unity and economic equality. This has quite a bit of information about Gandhi and his observations and...
Miami University
Chapter Nine Worksheet: Monopoly
Advanced economics pupils analyze a series of graphs, data sets, and profit scenarios all related to monopolies and marginal revenue. They read through the background information, complete a graph using the data provided, and justify...
Curated OER
Civil Rights and Casualties of Wartime
Do your historians fully grasp the consequences of being at war? Help them connect past with present through this group research activity, which has students analysing repercussions suffered by citizens of countries in conflict. Students...
Visa
Making Decisions
What economic factors can influence personal and financial decisions? In an effort to understand opportunity costs and the time value of money, pupils engage in role-playing activities and discussion, as well as view a PowerPoint...
Curated OER
Numbers Tell a Story
High schoolers connect census data to historical events. In this civics lesson plan, students understand cause and effect, and how they are reflected in census data and analyze census data for social and economic significance.
Curated OER
The People of Kansas: Where did they come from and why did they come?
Students review census data to correlate to emigration in Kansas. In this Westward Expansion lesson, students analyze a painting and create definitions for emigration and discuss why people emigrate. Students read and analyze 1855 census...
Curated OER
How to Graph in Excel
Fourth graders construct data graphs on the Microsoft Excel program. In this statistics lesson, 4th graders formulate questions and collect data. Students represent their results by using Excel.
National WWII Museum
Dr. Seuss and WWII
What famous children's author and illustrator created World War II political cartoons featuring such subjects as fascism, the war effort, discrimination, and the dangers of isolationism? The who in this story is Dr. Seuss, and what...


