Curated OER
Pick A Number
Elementary schoolers find out which month has the most class birthdays (mode) and which birthday represents the middle point of all the birthdays (median). They gather and organize data to find one number that fairly represents the whole...
Center for Math and Science Education
Solar System Launch
Trying to understand the vastness of outer space can be quite a challenge for young scientists. Help put things in perspective with this cross-curricular activity as students work in pairs creating scaled models of the solar system,...
Channel Islands Film
Cache: Lesson Plan 1 - Grades 9-12
Archaeologists have discovered a cache of Native American relics. They want to preserve these relics by removing them from the rapidly eroding site to a lab where they can be studied. Native American traditions demand that the items be...
Curated OER
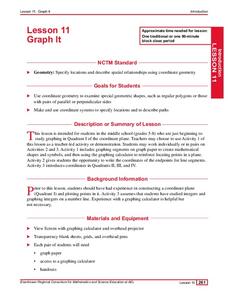
Graph It
Elementary and middle schoolers engage in a lesson of graphing in quadrant I of the coordinate plain. They use the graph to create shapes and symbols. While using a graphing calculator, they locate the points on the coordinate plane. In...
Curated OER
Elementary Statistics in Life
Students examine newspapers for graphs. They collect and sort data that is of interest to them. They enter data into a database and make comparisons using the information.
G. Turrell
Science Activity 1: Light & Sound
Are you looking for lab sheets to go with your class experiment on plant response to light? You are no longer in the dark! This is a lesson that was written for a unit on light, but could easily be used to demonstrate plant behaviors in...
Missouri Department of Elementary
STAR Deputies
Scholars become STAR deputies in a lesson that encourages them to be problem-solvers. Small groups gather to complete a worksheet by answering questions. A discussion presents a scenario in which a problem occurs on the playground. Small...
Curated OER
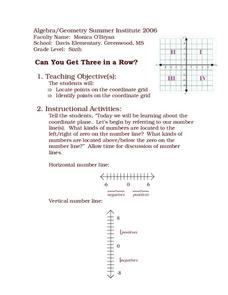
Three In a Row
Sixth graders examine how to locate coordinate points. In this coordinate graphing lesson, 6th graders locate the x and y axis. Students use their arms to show horizontal and vertical lines, participate in group and independent graphing...
Cornell University
Non-Newtonian Fluids—How Slow Can You Go?
Children enjoy playing with silly putty, but it provides more than just fun. Young scientists make their own silly putty using different recipes. After a bit of fun, they test and graph the viscosity of each.
Curated OER
Graphing Fun
First graders analyze objects and make a graphing picture to analyze the data. In this graphing lesson, 1st graders complete an object graph assessment, a picture graph assessment, and a bar graph assessment to analyze their given objects.
Curated OER
Graphing
Students investigate graphing. In this bar graph lesson, students view an informational website about graphing, then construct a class birthday bar graph outside with sidewalk chalk. Students choose a survey topic, then collect data and...
Curated OER
Math Can Be Electrifying
Students explore how math can be used to calculate and analyze how electricity causes air pollution. Students design a campaign to educate family members on ways they can save electricity. They create a graph that compares two electric...
National Gardening Association
Migration Mishaps
Elementary ecologists pretend to be migratory hummingbirds. They fly between wintering and nesting grounds, trying to reach a habitat haven. In a musical-chair fashion, some birds will miss out, and are removed from the game. To further...
Baylor College
What Makes Water Special?
Get close up and personal with a drop of water to discover how the polarity of its molecules affect its behavior. Elementary hydrologists split and combine water droplets, and also compare them to drops of oil. Much neater than placing a...
Curated OER
Dealing with Data
Seventh graders collect and analyze data. In the seventh grade data analysis lesson, 7th graders explore and/or create frequency tables, multiple bar graphs, circle graphs, pictographs, histograms, line plots, stem and leaf plots, and...
Curated OER
Veggie Chop and Data Analysis
First graders chop vegetables into fractions. In this fractions lesson, 1st graders cut vegetables, collect data about favorite vegetables and create a bar graph using the information. Students make inferences about the data and record...
Curated OER
The Hudson's Ups and Downs
Fifth graders practice interpreting line graphs of the Hudson River water levels to assess the tides and tidal cycles in the estuary. They explore how weather can affect water levels and tides and observe that high tides and low tides...
Curated OER
When is Your Birthday?
Students use data about their birthdays to create graphs. For this collecting and communicating information lesson, students make a class list of their birthdays. Students use the information to make a bar graph showing the information.
Curated OER
Earth Energy Budget Pre Lab
Students explore energy by conducting an in class experiment. In this climate change lesson plan, students conduct a water vapor experiment in a soda bottle. Students utilize graphs and charts to analyze the results of the experiment and...
Curated OER
Graph It!
First graders use organized data to construct real object graphs, picture graphs, and bar-type graphs.
Curated OER
Pictograph to Bar Graph
Second graders explore organizing data to make it useful for interpreting picture graphs and bar graphs. They use Graphers software to create a pictograph and a bar graph.
Curated OER
Sorting and Graphing Animals
Students inquire about animals using SIRS Discoverer or eLibrary Elementary. In this organizing data lesson, students sort pictures of animals in various ways and develop graphs. Students locate a mammal, reptile, fish, insect or bird...
Curated OER
Graph a Panther's Diet
Young scholars examine the diet of panthers. In this interpreting data lesson, students collect data on the panther's diet and chart the data in bar and pie graphs.
Curated OER
Graphing Conversation Hearts
Students collect data and create a graph. For this mathematics lesson, students separate paper hearts by color and create a graph showing the number of hearts of each color present. Students receive a handful of candy hearts that they...


