Curated OER
Why Is It Hotter At the Equator?
Students investigate the different heating effects of sunlight. They conduct an experiment that demonstrates the way sunlight strikes the equator, the poles and other parts of the globe.
NOAA
Graphing Temperatures
Battle of the hemispheres? In the fourth installment of a five-part series, young oceanographers use the NOAA website to collect temperature data from drifters (buoys), one in the Northern Hemisphere and one in the Southern Hemisphere....
Curated OER
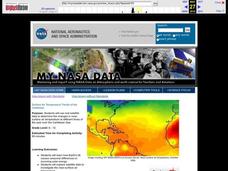
Surface Air Temperature Trends of the Caribbean
Students use real satellite data to determine the changes in near-surface air temperature at different times of the year over the Caribbean Sea. They discover how Earth's tilt causes seasonal differences in incoming solar energy. They...
Curated OER
The Solstices
Compare surface temperatures when the solstice occurs in the different hemispheres. Young scientists draw conclusions from their investigation of data collected using spreadsheets and a globe.
NOAA
Climographs
In the second lesson plan of a five-part series, young climatologists use provided temperature and precipitation data to create climographs of three different cities. They then analyze these climographs to develop a general understanding...
Curated OER
Micro-Climate
Atmosphere aces investigate the microclimates that exist within a larger area. They use a thermometer to record the varying temperatures and identify the microclimates on a map that they have drawn. This exercise helps them to understand...
Curated OER
Climatic Changes
Investigate the greenhouse effect and global warming with this weather worksheet: scholars describe the seasonal variations of temperature and day length at its greatest and its least. Then they describe the effects of El Nino and how...
Curated OER
Weather Lesson 1
Learners describe and compare the layers of the atmosphere. They explain how to measure the temperature of the atmosphere. They also explain what causes the atmosphere to heat up in some places more than in others.
Curated OER
World Geography - Climate Notes
A challenging activity helps young geographers explore the temperatures around the world! They study how the Earth's land temperatures are affected by their proximity to an ocean, as well their latitude and their altitude. A very...
PBS
Ocean Circulation in the North Atlantic
Swirling and churning, the waters of the North Atlantic play a vital role in Earth's climate! Discover the many factors that produce circulation using a multimedia lesson from PBS's Weather and Climate series for high schoolers. Scholars...
Curated OER
Adopt a City-Winter Weather
In weather worksheet, learners use an on line site to collect weather data. They create 10 different weather scenarios using a temperature and humidity slider. They includethe temperature, relative humidity and weather conditions and...
Curated OER
Weather With a Latitude
Students read the temperature from a thermometer. In this weather lesson, students read a thermometer and record the temperature at twenty minute intervals. Students discuss results.
Curated OER
Hurricane Strength: Spatial Association of Wind Speed and Water Temperature
In this hurricane activity, students read and analyze satellite images of hurricane Rita. They complete 4 short answer questions about it.
Curated OER
Is Temperature Effected By How Close You Are to the Equator
Young scholars collaborate with other schools to gather temperature data from a large number of locations. They determine how the average daily temperature of a location is affected by how close you are to the equator.
Curated OER
Sea Surface Temperature Trends of the Gulf Stream
Students explore the importance of the Gulf Stream. Using a NASA satellite images, they examine the sea surface temperature. Students collect the temperature at various locations and times. Using spreadsheet technology, they graph the...
Curated OER
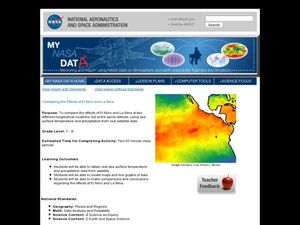
Comparing the Effects of El Nino and La Nina
Students examine the differences between an El Nino and La Nina year. In this investigative lesson students create maps and graphs of the data they obtained.
Curated OER
Rainforest Data
In this geography instructional activity, students use the climate data given to create a temperature line graph and rainfall bar graph for each of three locations given. Then they use an atlas to compare their graphs and draw...
Curated OER
The Air Around You
In this air worksheet, students will answer questions about the Earth's atmosphere, including the layers, air masses, and heat transfer. Students will explore how the difference in atmospheric temperature can create weather patterns....
Curated OER
Surface Air Temperature Trends of the Caribbean
Students investigate the seasonal changes to sea surface and near-surface air temperatures near the equator. They use actual satellite data to track and graph the differences in air and sea temperatures during different seasons in the...
Curated OER
Sea Surface Temperature Trends of the Gulf Stream
Learners use authentic satellite data to produce plots and graphs of sea surface temperature as they explore the seasonal changes of the Gulf Stream.
Curated OER
In the Eye of the Hurricane
For this science worksheet, students read about temperature and thermal energy in a hurricane. Students also draw their own hurricane and label 5 different parts.
Curated OER
What's Your Temperature?
Learners take a look at the local newspaper and focus on the weather section. They get into small groups, and each one looks at the same map, but of a different part of the country. They must prepare a presentation that shows how...
National Wildlife Federation
Ghost Town
Around 93 percent of the reefs on Australia's Great Barrier Reef have been bleached, and almost one quarter of them are now dead. Scholars research the sea temperatures, especially around the areas with coral reefs, to make connections...
Curated OER
Rain Forest Adventures
Students identify and describe where tropical rain forests are located and examine the geographical correlation between rainfall and rain forest. They brainstorm what they think they know about tropical rain forests - where they're...


