Curated OER
Measurement
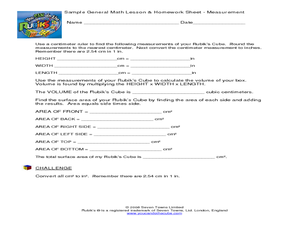
Students measure angles, perimeter, area and volume. In this geometry instructional activity, students define different ways to measure and solve for the perimeter, area and volume of geometric shapes. They analyze and process...
Curated OER
Appliance Energy Use and Cost
In this energy usage worksheet, students use a chart comparing the average monthly kilowatt-hour use of different household appliances to complete 4 short answer questions.
Curated OER
The Robot Ranger
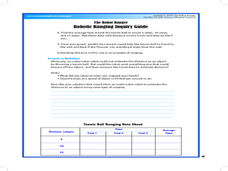
Students participate in an experiment to understand how robotic systems can estimate distances. In this robotic ranger instructional activity, students measure the the time it takes for and object to move back and forth. ...
Illustrative Mathematics
High School Graduation
An exercise in finding the approximate time that a name would be called at a graduation. Estimating time may be difficult for some of the class, so this resource would not be a good choice for learning this standard. It does end with a...
Curated OER
Estimating the Live Mass of Dinosaurs
Students calculate the volume of scale model dinosaurs using a water displacement method. They use formulas to calculate the live mass each of the species of dinosaur. Then they complete and discuss a series of questions.
Curated OER
Estimating the Live Mass of Dinosaurs
Young scholars estimate the live mass of dinosaurs. Using dinosaur and modern animal models, students use simple displacement methods to calculate the volume of the models. They calculate the masses of each model. Young scholars...
BW Walch
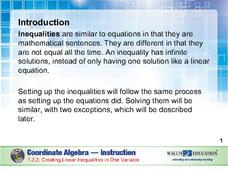
Creating Linear Equations in One Variable
The example of two travelers meeting somewhere along the road has been a stereotypical joke about algebra as long as algebra has existed. Here in this detailed presentation, this old trope gets a careful and approachable treatment....
National Security Agency
Awesome Area - Geometry and Measurement
Break out those math manipulatives, it's time to teach about area! Capturing the engagement of young mathematicians, this three-lesson series supports children with learning how to measure the area of squares, rectangles, and other...
101 Questions
Circle-Square
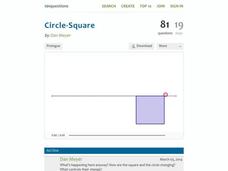
How do the area and perimeters of circles and squares compare? A clever video illustrates the change in the area of a circle and square while their total perimeter stays the same. The task is for learners to predict the point where the...
Illustrative Mathematics
How Thick Is a Soda Can I?
The humble soda can gets the geometric treatment in an activity that links math and science calculations. After a few basic assumptions are made and discussed, surface area calculations combine with density information to develop an...
BW Walch
Creating Linear Inequalities in One Variable
Just when a young mathematician starts to feel comfortable turning word problems into linear equations, shake things up and throw inequalities in the mix. This excellent, instructive presentation takes the steps for solving an...
Charleston School District
Scientific Notation and Appropriate Units
How do you write a number in scientific notation? The handout and video provide an explanation on how to convert from standard form into scientific notation and vice versa. The resource also contains a short discussion about choosing...
Concord Consortium
Fermi Time
It's all just a matter of time. The resource provides four Fermi questions in reference to time. The questions are open-ended and require classmates to make use of estimation and dimensional analysis.
Pingry School
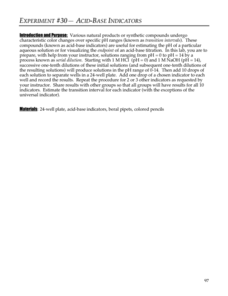
Acid-Base Indicators
Acid-base indicators are an essential part of any chemistry classroom. Individuals explore the color-changing feature of the important indicators in a vibrant hands-on activity. Using serial dilution, learners create solutions ranging...
Illustrative Mathematics
How Many Leaves on a Tree?
This is great go-to activity for those spring or fall days when the weather beckons your geometry class outside. Learners start with a small tree, devising strategies to accurately estimate the leaf count. They must then tackle the...
CK-12 Foundation
Interpretation of Circle Graphs: Northwest Region Population Pie
Given populations of the five Northwestern states, learners create a circle graph. Using the data and the pie chart, they make comparisons between the populations of the states. Finally, the pupils determine how the chart will change...
Curated OER
Profit From Pumpkins
Third graders cut open a pumpkin. In this math activity, 3rd graders complete the worksheet "From Seed to Pumpkin" and then clean out their pumpkins to see how many seeds are in it.
Curated OER
Five Second Dash
Learners estimate how far they can run, jump, or hop in five seconds, then check their prediction. In this estimation lesson, student predict how far they can run, hop, or jump in five seconds and then try it.
Curated OER
Pumpkin Carving for K-2 Students
Learners carve pumpkins, draw pictures and label layers of a seed, and write steps needed to carve pumpkin.
Curated OER
Count On It!
Young scholars investigate money. In this consumer math lesson, students use coins, identify their value, then group them in various ways to equal a dollar.
Curated OER
More! A Lesson on Comparing
Students practice counting and comparing objects. In this math lesson plan, students view a Count on It! episode. Students examine the value of what they are counting. Students estimate number in groups of items. ...
Curated OER
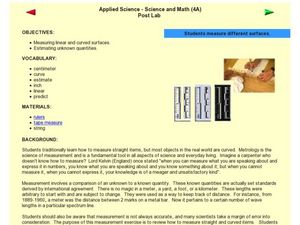
Measuring Different Surfaces
Fourth graders investigate measurement of linear and curved surfaces. In this math lesson, 4th graders discuss how to measure curved surfaces and work with a partner to measure various curved surfaces.
Curated OER
Estimating Fish Populations
Students describe the mark/recapture method used to estimate fish populations. They explain the importance of being able to predict population numbers.
Curated OER
Learning with Links
Students explore the concept of counting, measuring, and estimating. In this counting, measuring, and estimating lesson, students use plastic links to count sets of links. Students measure their arms and legs using links.
