National Education Association
Interpret the Rate of Change/Slope and Intercepts within the Context of Everyday Life
Rates of change can be a slippery slope. The resource makes the connection between the rate of change and the slope of a line. It continues on to provide examples of how to interpret the slope and the y-intercepts of linear equations...
Curated OER
Calculate the Slope of a Line Using Two Points
Find that slope! This video does an excellent job of demonstrating how to use the slope formula to find the slope of a line using two points. The instructor first reviews the definition of slope of a line, then works three problems using...
National Education Association
Determine Minimum, Maximum, Vertex, and Zeros Given the Graph
Do not always be maxed out by the vertex. A short video introduces the graphical display of the vertex and zeros of a quadratic function. The presenter provides the definitions of the minimum and maximum of the graph along with...
Curated OER
Translate Word Phrases and Sentences into Equations
Use this video to show your learners an example of how to translate word phrases into an equation to solve a real-world problem. The presenter begins with a review of how to use cross products to solve a proportion, including how to do...
National Education Association
Solving Absolute Value Inequalities
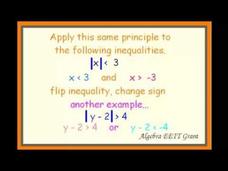
You know how to find absolute values and you know how to solve inequalities — but what happens when these two concepts are in the same problem? A YouTube video first reviews absolute values and moves on to solving absolute value...
Curated OER
Solving Equations
A mathematics video explains the parts of an equation and reviewing relevant vocabulary. Next, it covers one-, two-, and multi-step equations. It includes a few example problems for each type as well.
National Education Association
Scatter Plots and Line of Best Fit
Demonstrate how to use a box and whisker plot to place a line of best fit accurately with an educational video. It begins with a review of box and whisker and line of best fit, and then uses an application problem to describe the...
National Education Association
Scatter Plots
What's my line, anyway? A video covers the aspects of finding an equation of the best-fit line for a set of data. It works through plotting the points to drawing a line that appears to represent the data. The presenter suggests finding...
National Education Association
Inappropriate Data Usage
Correlate the responses to identify the cause. A resource presents how individuals sometimes confuse the issue between correlation and causation. The video provides examples of different variables that are correlated — but one does...


