Stats Monkey
Everything I Ever Needed to Learn about AP Statistics I Learned from a Bag of M and M's®
Candy is always a good motivator! Use this collection of M&M's® experiments to introduce statistics topics, including mean, standard deviation, nonlinear transformation, and many more. The use of a hands-on model with these AP...
American Statistical Association
Happy Birthday to . . . Two?
How many people do you need in a room before two likely share the same birthday? Scholars consider this puzzle by analyzing a set of data. They ponder how to divide the data and determine the proper size of a group for this event to...
Curated OER
Brain Brands
Students explore the advent of neuromarketing as a means to assess the effects of certain brands on the brain activity of prospective buyers. They design their own experiments that test the power of certain brands on a sample population.
EngageNY
Differences Due to Random Assignment Alone
It takes a lot of planning to achieve a random result! Learners compare results of random assignment, and conclude that random assignment allows results to be attributed to chance. They also realize the set of random means are clustered...
Curated OER
Probability
Ninth graders engage in a lesson that is about the concept of probability using the context of recording data and predicting outcomes. They collect marbles while recording data and graphing it. The graph is analyzed and ideas are...
Radford University
Understanding Local Economic Issues Using Statistics
A good understanding of local economics requires a lot of data. Scholars design and conduct an experimental survey to collect information about economic issues affecting their regions. They analyze their findings and prepare a...
Actis
Handling Data: Probability, Tree Diagrams
Clean, but captivating, two online simulations demonstrate probability for middle schoolers. They can choose the number of coins and tosses and watch as the results pile up. They can choose from a variety of spinner types and the number...
Curated OER
Remote Possibilities
Students collect data and analyze the data using a graph. In this statistics lesson, students use combinations and theoretical and experimental probability to analyze their data. They observe a remote controlled robot as they collect data.
Curated OER
R-Project
Young scholars analyze the outcome of a scientific experiment using free downloadable software. They collect experimental data to use statistical software to determine if the observations are likely due to the treatment or random chance.
Curated OER
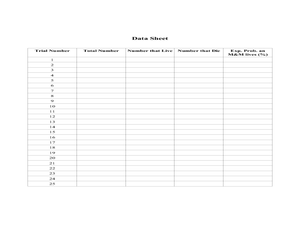
RIP M&M's
Students solve theoretical probability problems. In this algebra lesson, students apply the concept of probabilities to solving real life scenarios. They collect data and graph it using experimental probability.
Curated OER
Charting the Weather
Learners research and conduct non-experimental research, such as journals, the weather channel and the internet, to collect and record data for analysis on weather conditions in the United States and abroad. They identify, pronounce and...
Curated OER
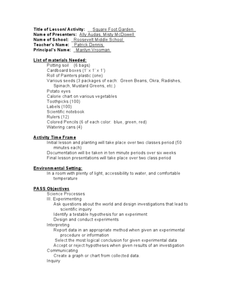
Square Foot Garden
Students plant a garden and keep track of it. For this geometrical garden lesson, students collect data from their garden twice a week. They graph their finding and figure out how many square feet of growing space each person needs for...
Curated OER
A Statistical Study of Three Biomes
Students collect data from one of three selected biomes. Data are then organized and statistically analyzed. This project engages students of different backgrounds grouped cooperatively in a relevant outdoor hands-on learning experience.
Curated OER
Playing With Probability
Students rotate through work stations where they compute problems of theoretical and experimental probability. In this probability lesson plan, students use simulations of a lottery system.
Curated OER
Probability Lesson Plan
Your learners will examine probability through experiments and dice games. Using a computer, your class will perform simple experiments to collect and analyze data to determine the probability of different experimental results. Students...
Curated OER
Discovering Advanced Algebra More Practice Your Skills, Lessons 11.1-11.6
For this six page series of worksheet, students answer short answer questions about a variety of topics. The six topics covered in this packet are: Experimental Design (4 questions), Probability Distributions (3 multiple choice...
Curated OER
ng Data: Probability, What's in the bag?
Students use the language associated with probability to discuss events including those with equally likely outcome. They collect data from a simple experiment and record in a frequency table: estimate probabilities based on this data
Curated OER
Sampling Distribution of Sample Means
Young scholars collect data and crate a distribution sample. In this statistics lesson, students compare and contrast their collected data. This assignment requires the young scholars to be comfortable with navigating the internet.
Curated OER
Introduction to Graphical Representation of Data Sets in Connection with Nuclear Decay
Students record data, make observations, and share in experimentation and discussion of numerical experiments.
Curated OER
The M & M Function
In this M & M worksheet, learners perform probability experiments. They collect and interpret data, identify the exponential function describing the data and create graphs from the collected information. This one-page worksheet...
Kenan Fellows
Density
Most scholars associate density with floating, but how do scientists determine the exact density of an unknown liquid? The third lesson in a seven-part series challenges scholars to find the mass and volume of two unknown liquids. Each...
Curated OER
The Probability Scale
Students collect data and make predictions. In this probability lesson, students perform experiments calculating the chance of an event occurring. They draw conclusion based on their data.
S2tem Centers SC
Investigating Chance Processes of Probability
How likely is it that the school cafeteria will serve chicken tomorrow? Discover the concept of probability with the roll of the dice. Pupils evaluate the liklihood of several statments about everyday life. Then, a mathematical...
Mathematics Assessment Project
Modeling Motion: Rolling Cups
Connect the size of a rolling cup to the size of circle it makes. Pupils view videos of cups of different sizes rolling in a circle. Using the videos and additional data, they attempt to determine a relationship between cup measurements...


