Curated OER
Tracing Highs and Lows in San Francisco
On a topographic map, students identify the scale bar, north arrow, and contour interval. They then locate a hill on the map and make note of the contour lines. Students then locate other places with similar contour line patterns....
Curated OER
Worksheet 24 - Derivative
In this derivative worksheet, students identify second derivatives and find the directional derivative of a function. They also list the extremes and saddle points of a function. This one-page worksheet contains seven multi-step problems.
Curated OER
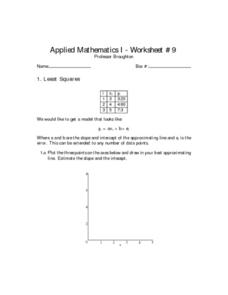
Least Squares
In this least squares learning exercise, students solve 6 different problems that include the least squares of numbers. First, they plot 3 points on the axes shown and draw in their best approximating line. Then, students estimate the...
Curated OER
Is there Treasure in Trash?
More people, more garbage! Young environmentalists graph population growth against the amount of garbage generated per year and find a linear model that best fits the data. This is an older resource that could benefit from more recent...
Curated OER
A Sweet Drink
Students investigate reaction rates. In this seventh or eighth grade mathematics lesson, students collect, record, and analyze data regarding how the temperature of water affects the dissolving time of a sugar cube. Studetns...
Curated OER
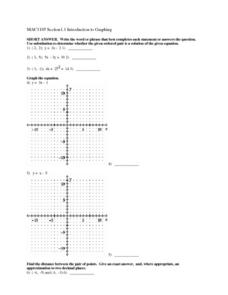
Introduction to Graphing
In this graphing worksheet, students graph linear equations on a coordinate plane. Students identify the slope and y-intercept of each problem, find the midpoint of a line, and the distance between given points. Given an equation,...
Curated OER
Slope
In this slope learning exercise, students solve and complete 3 different types of problems. First, they find the slopes of the lines passing through each sets of coordinate pairs. Then, students find the parameter so that the line...
Corbett Maths
Instantaneous Rates of Change
Here's a great lesson that looks at slope as an instantaneous change. Using an estimated tangent line, the presenter shows the class how to find an approximation for the instantaneous rate of change. Scholars determine the slope of the...
Willow Tree
Linear Relationships
There's just something special about lines in algebra. Introduce your classes to linear equations by analyzing the linear relationship. Young mathematicians use input/output pairs to determine the slope and the slope-intercept formula to...
Radford University
Linear Equations in Real Word Problems
Make up a story about a linear graph. Scholars identify key features of a linear graph, such as intercepts, domain and range, and slope. They then create a word problem that could be represented by the graphed line.
National Council of Teachers of Mathematics
Bank Shot
Bank on geometry to line up the shot. The resource asks the class to determine the location to bank a cue ball in a game of billiards. Using their knowledge, class members determine where to hit the bumper to make a shot and discuss...
Curated OER
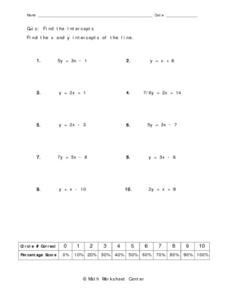
Find the Intercepts
In this intercepts worksheet, 9th graders solve 10 different problems that include determining the intercepts of each equation. First, they set y equal to zero and solve for x. Then, they set x equal to zero and solve for y. They also...
Curated OER
Worksheet 13: Slope and Concavity
In this function instructional activity, students determine the equation of a line, compute slope and concavity of a graph, and find the maximum volume of three-dimensional figures. This one-page instructional activity contains six...
Curated OER
Mathematical Analysis of Temperature Scales
Students use the point-slope formula to determine the relationship between the Celsius and Fahrenheit scales of temperature. They use a graphing calculator to determine the slope of the line between two points in each scale.
Curated OER
Graphing Functions With 2 Points and From a Graph
Students plot points on a coordinate plane. They describe, in words, methods for finding the slope of a line. After given a worksheet, students read instructions, draw a Cartesian plane, plot ordered pairs, and graph lines. Papers are...
Curated OER
Secant and Tangent Lines
Twelfth graders recognize the use of the slope of the secant line and connect it with the graph of the secant line, as the secant line approaches the tangent line. They also recognize the two forms of the slope formula used and practice...
Illustrative Mathematics
Slopes and Circles
An upper-level treatment of what is often presented as a basic concept (the right angle of an inscribed circle on the diameter), this activity really elevates the mathematical thought of the learner! Expected to develop formulas...
Curated OER
Race The Rapper: Slopes
Learners calculate the slope of the equation In this algebra lesson, students graph coordinate pairs of linear equations and identify the relationship between x and y values and slope. They differentiate between functions and...
Illustrative Mathematics
Two Lines
Here is a resource that helps your algebra learners understand the connection between the graph of two lines, the equations of lines, and the solutions and intersecting points of lines. It would make a great assessment question, but can...
Curated OER
Analyzing Equations Through Slope and Y intercepts
Learners analyze equations using the slopes and intercept. In this algebra lesson, students graph equations give the slope and y intercepts. They are also asked to identify the slope and y intercept from a given graph. They solve real...
Curated OER
Calculating Slope
Students find the slope using a slope formula. In this algebra worksheet, students use a pair of coordinate to identify the slope and y intercept. There are 7 questions.
Curated OER
Lines of Fit
Students solve equations dealing with best fit lines. In this algebra lesson, students solve problems by analyzing data from a scatterplot, and define it as positive, negative or no correlation. They classify slopes the same way as...
Curated OER
Lines of Fit
Students graph an equation and analyze the data. In this algebra lesson, students graph scatter plots and identify the line of best fit using positive correlation, negative correlation an d no correlation. They apply their data analysis...
Curated OER
Analyzinf Equations Through Slope and Y intercept
Students solve equations representing exponential functions. In this algebra instructional activity, students interpret their equations by analyzing the slope and y intercept. They find the slope using the slope formula.


