Curated OER
M&M’s Math Worksheet
Who knew you could cover prediction, histograms, fractions, decimals, data collection, and averages (mean, median, and mode) all with a bag of M&M's®? Here's a fantastic set of worksheets to help you make candy a mathematical journey...
Mathematics Assessment Project
Mean, Median, Mode, and Range
What a find! Here is a lesson plan, designed to meet sixth grade math Common Core standards, that focuses on the calculation of different measures of center for the scores from a penalty shoot-out competition. An independent...
Curated OER
Using Averages
In this math worksheet, students compute the range, mean, median and modal weight of candy bars from two machines. Students write a short essay about which machine is using too much chocolate and which is more reliable.
Curated OER
Problem Solving: Find an Average
In this finding the average word problem worksheet, students problem solve and explain why the average is reasonable or not reasonable. Students solve six problems.
Curated OER
Twelve Average Speed/Rate Word Problems
In this word problem worksheet, students solve twelve word problems discussing average speed or rate. The solutions are provided.
Curated OER
Average of Numbers
Fourth graders find the average of a set of numbers. In this math lesson, 4th graders add up a group of numbers and divide by the amount of numbers there are. They complete a worksheet and work in groups to find the averages in multiple...
Curated OER
Averages
In this averages worksheet, 6th graders solve and complete 3 various types of problems. First, they find the mean, mode, median and range for each set of data shown. Then, students match each team to the picture shown that they think...
Curated OER
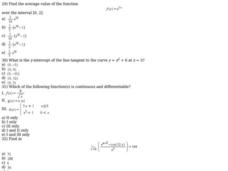
Find the Average Value of a Function
In this calculus worksheet, 11th graders calculate the average value of a function. They find the line tangent to a curve and graph the equation. There are 15 questions.
Curated OER
Average Value of a Function
For this calculus worksheet, 12th graders calculate the line tangent to a curve and find the average value of a function. There are 12 questions.
Curated OER
Maps and Modes, Finding a Mean Home on the Range
Fifth graders investigate data from maps to solve problems. In this data lesson, 5th graders study maps and collect data from each map. Students present their data in a variety of ways and calculate the mode, mean, median, and range.
Curated OER
Central Tendency
In this central tendency activity, 8th graders solve 10 different problems that include determining the mean, mode, and median of various situations. First, they prepare a frequency distribution with a class interval for the data found...
Math Mammoth
Bar Graphs 1
In this bar graph activity, students organize data in a frequency table, then create a bar graph. They find the average of the data. This one-page activity contains two multi-step problems.
Curated OER
Mean, Median, Mode, and Range
In this mean, median, mode, and range worksheet, students define and solve 5 detailed questions that include finding the mean, median, mode, and range of numbers. First, they calculate the mean, median, mode, and range for each set of...
Curated OER
Leveled Problem Solving: Experimental Probability
In this using probability to solve word problems worksheet, students use statistics, averages, and even numbers, to problem solve. Students solve six problems.
Curated OER
The Mathematical Implications of Lying
Students explore how statistics can be interpreted in different ways. In this probability lesson students complete a class lab activity then discuss their findings.
Raytheon
Working With Mode, Median, and Mean
For this data analysis worksheet, students solve five questions by finding the mode and median of each set of numbers. On the second page, students find the mean of six sets of numbers. On the third page, students find the mode, median,...
Curated OER
Mean Averages
Fourth graders examine a number of data sets while practicing finding the mean, median, and mode of the numbers.
Curated OER
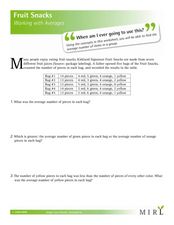
Working with Averages
In this fruit snacks worksheet, students find the averages of different amounts of fruit snacks from a chart. Students complete 7 problems total.
Curated OER
Averages
In this averages worksheet, students complete word problems where they find the average (sometimes called 'mean') of numbers. Students complete 10 multiple choice word problems.
Curated OER
Challenge Sheet 3: Average Value of a Function
In this average value worksheet, learners determine the average value of functions, sketch graphs of continuous intervals, evaluate integrals, find the average value of a function and convert limits to a definite integral. This one-page...
Centre for Innovation in Mathematics Teaching
Ten Data Analysis Activities
This thirteen page data analysis activity contains a number of interesting problems regarding statistics. The activities cover the concepts of average measurements, standard deviation, box and whisker plots, quartiles, frequency...
Curated OER
Indy 500
Start your engines! Small groups collect data from websites pertaining to the Indianapolis 500 in order to determine average speed per lap and miles in each lap. The lesson requires prior knowledge of the the formula d=rt.
Education Development Center
Choosing Samples
What makes a good sample? Your classes collaborate to answer this question through a task involving areas of rectangles. Given a set of 100 rectangles, they sample a set of five rectangles to estimate the average area of the figures. The...
Curated OER
Estimate and Compare Data
Seventh graders explore the values that are used in order to describe data that is collected or given. They compare data using the statistical analysis provided by finding the mean, median, and range.


