Curated OER
Choosing the Best Graph
In this mathematics worksheet, 6th graders use a line graph to illustrate how a measure of data changes and explain their reasoning. Then they use a bar graph to compare pieces of data and a pictograph to compare data.
Curated OER
Ocean Temperatures
Students list data collected by marine buoys and the different kinds of moored buoys. They describe how data is transmitted worldwide. They explain the difference between near shore and offshore air and water temperatures.
Curated OER
How Creepy!
Pupils observe and measure a model of slow down slope movement. In this graphing lesson students collect, record, and organize data that apply to models.
Curated OER
Animal Homes
Students explore how an animal's relationship to its habitat affect the animal's survival. They discuss animal habitats and the animal's relationship to that habitat through the food chain, life cycle, community, and balance of nature....
Curated OER
Operation Mexfly
Students research information about pesticides. Students discuss the history of the Mexican fruit fly. They experiment to discover malathion concentration levels in organisms. Students explore the effect of toxins at the top of the...
Curated OER
Forest Floor Terrarium
Students study the aspects of a forest floor ecosystem, including decomposition, the water cycle, food webs, the needs of living things, and physical vs. chemical change over an extended period. In addition, students conduct observations...
Curated OER
Give Me a Minute
Students categorize data. In this categories instructional activity, students get a specific topic and they have a minute to list as many items that fit under this topic. They compare lists with a classmate and discuss whether all...
Curated OER
Globalization and the Standardization of Identity
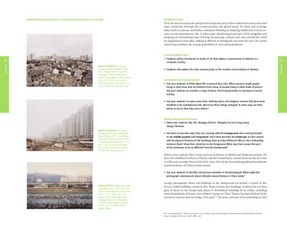
Young scholars analyze art of changing identities of cities and populations. In this art analysis lesson plan, students analyze the works of art that address constructions of identity in a consumer society. Young scholars explore the...
Humanities Texas
A President's Vision: Theodore Roosevelt
Through an engaging, interactive experience analyzing primary sources, invite your young historians to take a closer look at the presidency of Theodore Roosevelt.
Core Knowledge Foundation
Ecology Tell It Again!™ Read-Aloud Anthology
A read-aloud anthology provides informational texts about ecology to boost reading comprehension. Third-graders listen and discuss readings where they answer questions and focus on vocabulary. Pupils complete extension activities,...
Curated OER
Add and Subtract with Hudson River shipping
Rivers aren't just a place for animals to live, they also provide industrial transportation. The class will examine the Hudson River on a map, discuss all the commercial vessels that use the River to transport materials, then complete a...
Curated OER
Retelling Information
This scripted lesson suggests using the journalist’s five W’s (who, what, when, where, why) to teach readers how to summarize a story and to how to distinguish between significant and supporting details. A template and rubric are...
Curated OER
Slash Trash! Reducing, Reusing and Recycling Our Way to Zero Waste
The other "Three Rs" are covered in this lesson: reduce, reuse, and recycle. Over four weeks, conservationists collect data about waste in their own homes. They combine their findings with those of other students in order to analyze...
Council for Economic Education
Athens and Olive Oil
Athens had olive oil—and lots of it! However, it needed wheat from the Egyptians. Understanding how societies get what they need through advantage and trade can be complicated. A scripted role-play exercise and in-class production...
Curated OER
Data From Interviews
Learners create and conduct a survey about favorite foods, gather and represent the data, interpret data and make predictions to present to the class. They create and use interview questions to gather data. Pupils are explained that...
Curated OER
Is Organic Food Worth the Extra Cost?
High schoolers calculate the amount of pesticide residue in selected foods for two
pesticides and determine if these levels are safe. They read an article about a
research study looking for metabolites of these pesticides in children....
Curated OER
Colorimetric Determination of the Concentration of Blue Food Coloring in Sport Drinks
Seventh graders determine the amount of blue food coloring in sports drinks and plot the concentration and absorbance data. They summarize the data and determine why companies need to know the amount of chemicals in their products.
Curated OER
Science: Coral Reef Food Pyramid
Pupils construct numbers pyramids using fictional data from a coral reef. they tally the numbers of carnivores, herbivores, and producers. Students next build a pyramid shape in which they put their numbers of producers, herbivores,...
Curated OER
Transforming Food Energy: A Balancing Act
Students explain their role as consumers. They use a purchased calorimeter or make their own simple calorimeter to measure the energy content in selected foods. This interesting lesson really gets students thinking about what they eat.
Curated OER
Genetically Modified Foods
Students explain what genetically modified foods are and how they are created. Students use appropriate vocabulary to describe and effectively discuss the benefits of, and potential risks of, genetically modified foods.
Education World
Hot Chocolate Testing
In this set of science experiment worksheets, learners examine and record nutrition information from a number of labels off of hot chocolate mixes. They follow follow the directions to participate in a taste and dissolving ability tests...
Curated OER
Food Safety and Quality Assurance
High schoolers identify and interpret how milk is processed and learn important concepts in food safety and quality assurance. They identify how milk is processed, the importance of food safety, and the quality assurance process....
Curated OER
Tracy Aviary Wetland Restoration Module - WEST
Students become engaged in wetland conservation as they take part throughout the school year in restoring a small wetland at the Tracy Aviary. They visit the Tracy Aviary wetland at various times during the year and become involved in...
Curated OER
Favorite Foods at Thanksgiving
Fourth graders study different types of graphs as a means of displaying information. They survey others to find their favorite Thanksgiving food and then graph the results using different types of graphs.


