EngageNY
Posing Statistical Questions
Is this a statistical question? The opening lesson in a series of 22 introduces the concept of statistical questions. Class members discuss different questions and determine whether they are statistical or not, then they sort the data...
Howard Hughes Medical Institute
Gorongosa: Scientific Inquiry and Data Analysis
How does the scientific process begin? Introduce ecology scholars to scientific inquiry through an insightful, data-driven lesson. Partners examine data from an ongoing research study to determine the questions it answers. The resource...
Howard Hughes Medical Institute
Scientific Inquiry Using WildCam Gorongosa
How do scientists determine what questions to ask to meet their research goals? Help your class develop an inquiry mindset with a lesson based on studies in the Gorongosa National Park. Partners create their own research questions by...
Curated OER
How to Graph in Excel
Fourth graders construct data graphs on the Microsoft Excel program. In this statistics lesson, 4th graders formulate questions and collect data. Students represent their results by using Excel.
National Security Agency
Are You Ready to Call the Guinness Book of Records?
Learners design questions that can be answered by collecting data. In this line-plot activity, pupils collect data and graph on a line plot on world records. An abundant supply of teacher support is provided in this resource.
Curated OER
Rational and Irrational Numbers 2
Is the circumference of a circle always, sometimes, or never rational? Learners answer questions individually and also work in groups to look at sums and products of rational and irrational numbers. They must also be able to use the...
Curated OER
Worksheet 32: Kepler's Law
In this math worksheet, students are given 8 questions regarding Kepler's first law of motion. The questions include definitions, short essay explanations, and formulaic expressions.
Statistics Education Web
What Does the Normal Distribution Sound Like?
Groups collect data describing the number of times a bag of microwave popcorn pops at given intervals. Participants discover that the data fits a normal curve and answer questions based on the distribution of this data.
Curated OER
Pet Shop Decision
Students are given the "Pet Store Decisions" task sheet and a rubric that goes with it. Students discuss the task and make a plan for using the rubric sheet to complete the task. Students formulate questions, studies and data collection...
Statistics Education Web
Using Dice to Introduce Sampling Distributions
Investigate the meaning of a sample proportion using this hands-on activity. Scholars collect data and realize that the larger the sample size the more closely the data resembles a normal distribution. They compare the sample proportion...
American Statistical Association
Bubble Trouble!
Which fluids make the best bubbles? Pupils experiment with multiple fluids to determine which allows for the largest bubbles before popping. They gather data, analyze it in multiple ways, and answer analysis questions proving they...
EngageNY
Developing a Statistical Project
The 17th lesson in a unit of 22 presents asks the class to conduct a statistics project. Pupils review the first two steps of the process of asking a question and collecting data. They then begin the process by developing a...
Statistics Education Web
Text Messaging is Time Consuming! What Gives?
The more you text, the less you study. Have classes test this hypothesis or another question related to text messages. Using real data, learners use technology to create a scatter plot and calculate a regression line. They create a dot...
American Statistical Association
Colors Challenge!
Does writing the name of a color in a different colored ink affect one's ability to read it? Scholars design an experiment to answer this question. They collect the data, analyze the statistics, and draw a conclusion based on...
Statistics Education Web
How High Can You Jump?
How high can your pupils jump? Learners design an experiment to answer this question. After collecting the data, they create box plots and scatter plots to analyze the data. To finish the lesson plan, they use the data to...
Statistics Education Web
The United States of Obesity
Mississippi has both the highest obesity and poverty rate in the US. Does the rest of the data show a correlation between the poverty and obesity rate in a state? Learners tackle this question as they practice their skills of regression....
Curated OER
Residential Power System
Perform data analysis on energy consumption to apply algebraic expressions to the real world. Learners will write and solve equations that answer various questions from residential power use. They will collect data at home and calculate...
Inside Mathematics
Number Towers
Number towers use addition or multiplication to ensure each level is equal. While this is common in factoring, it is often not used with algebraic equations. Solving these six questions relies on problem solving skills and being able to...
Inside Mathematics
Quadratic (2006)
Most problems can be solved using more than one method. A worksheet includes just nine questions but many more ways to solve each. Scholars must graph, solve, and justify quadratic problems.
Federal Reserve Bank
Financial Goals
Do you have financial goals? How will you make them happen? Help your pupils answer these questions through this interactive project. They create goals and a plan for reaching them as one of many high school algebra projects.
Inside Mathematics
Two Solutions
Many problems in life have more than one possible solution, and the same is true for advanced mathematics. Scholars solve seven problems that all have at least two solutions. Then three higher-level thinking questions challenge them to...
Curated OER
Quinoa Pasta 3
A mixture of quinoa and corn is for dinner in this collaborative task that sets up nicely as a system of linear equations. Your supper guests discuss numerical precision and percentages as they formulate a plan of how to solve the problem.
EngageNY
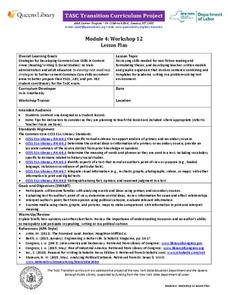
TASC Transition Curriculum: Workshop 12
How can opinions slant facts? Workshop participants learn how to examine primary and secondary sources and identify the author's point of view. They also examine how visual art impacts the meaning and rhetoric of sources. Full of...
Curated OER
Law of Sines Question and Answer day
Students investigate the correct use of the law of sines and cosines. In this precalculus lesson plan, students ask questions about their problems on solving these trigonometry problems. They spend the class period reviewing important...


