Curated OER
If Our Class Went to See the Prince
First graders read the story One Monday Morning and create picture graphs based on the number of teachers, boys, and girls that would visit the prince. In this data lesson plan, 1st graders interpret tables and graphs with the help of...
Curated OER
Reading the Neighborhood
First graders complete activities with the story One Monday Morning in the Macmillan/McGraw Hill Textbook. In this data lesson, 1st graders read the story and gather data to create a picture graph. They read the graph and answer...
Curated OER
Atlatl Lessons Grades 4-12: Lesson for Beginning Users of Atlatl
Sixth graders determine the mean, range median and mode of a set of numbers and display them. In this data instructional activity students form a set of data and use computer spreadsheet to display the information. They extend of...
National Security Agency
Going Green with Graphs
In this unit designed for second graders, youngsters are introduced to conducting surveys and creating tally charts based on the data they gather. Students then construct bar graphs, and observe the relationships between the two...
Howard Hughes Medical Institute
Building Ecological Pyramids
Looking for a fresh take on traditional food/energy pyramids? Conduct an innovative activity where pupils build their own! The lesson uses research data from Gorongosa National Park in Mozambique for a real-life safari touch. Scholars...
Curated OER
Survey Says...
Young statisticians collect, organize, and present data to illustrate responses to a survey question. They write and conduct the survey. They finish by presenting the results in the form of a graph.
Curated OER
Using Matrices for Data
In this matrices for data worksheet, 9th graders solve and complete 29 various types of problems that include using matrices to illustrate data. First, they determine the sum, difference and scalar product for each matrices shown. Then,...
Curated OER
Data From Interviews
Students create and conduct a survey about favorite foods, gather and represent the data, interpret data and make predictions to present to the class. They create and use interview questions to gather data. Pupils are explained that...
University of Colorado
The Moons of Jupiter
Middle schoolers analyze given data on density and diameter of objects in space by graphing the data and then discussing their findings. This ninth installment of a 22-part series emphasizes the Galilean moons as compared to other...
Curated OER
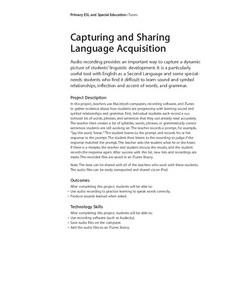
Capturing and Sharing Language Acquisition
Practice language development and linguistics with a lesson featuring audio recordings. As kids record the ways they pronounce words and sentences, they learn to upload and organize their audio files into iTunes.
Curated OER
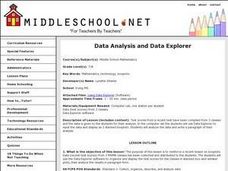
Data Analysis and Data Explorer
Students use the Data Explorer software to organize and display the test scores for the classes in stacked box-and-whisker plots, then analyze the results in paragraph form.
Missouri Department of Elementary
Ingredients of a Relationship Recipe
An eye-catching hook makes a smart analogy between ingredients for a food recipe and ingredients for quality relationships. Scholars discuss and list qualities they feel contribute to positive interactions. Pupils create a recipe card...
Curated OER
Get Ready, Get Set, Get Organized! Lesson 2 of 2
Seventh graders examine the importance of being organized when making transitions. In this organization lesson, 7th graders watch a teacher demonstration of entering a room in a disorganized manner before discussing how the transition...
Curated OER
Give Me A Break!
Students create and conduct a survey. In this broken bones lesson, students discuss if they've ever broken a bone and how a broken bone heals. Students generate questions for a survey on broken bones and healing time, conduct the survey...
Curated OER
Statistical Pictures of School and Life
Students explore how mathematical data is used to summarize and illustrate everyday life. They apply mathematical concepts and skills to analyze data. Students conduct a five question survey of 50 people or more and graph the data.
Curated OER
It's Time for Testing Skills Rock!
Fourth graders take an inventory to assess their ability to utilize study and test taking skills. They receive the "Testing Skills Rock" song and start singing it. Students identify and underline the test taking skills mentioned in the...
101 Questions
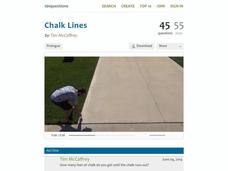
Chalk Lines
Read between the lines to find a solution. Budding mathematicians analyze a situation to solve a problem. They view a video presentation of the problem, brainstorm important information to gather, and write linear equations to find...
Curated OER
Lessons for Atlatl Users with Some Experience-Grade 6
Sixth graders experiment with an atlatl and dart. In this sixth grade data management mathematics lesson plan, 6th graders explore and determine the most suitable methods of displaying data collected from their experimentation with...
Pennsylvania Department of Education
Freckle Face
Students collect and record data. In this early data analysis lesson, students gather data about their partners face. As a class, the students use tally marks and pictographs to record the data and answer question about the information...
Curated OER
Radioactive Decay Curve
Students gather and organize data. In this radioactive decay curve activity, students gather data as they follow the provided procedures for rolling dice. Students chart their data and examine interval results.
Curated OER
Jellybean Graphs
Second graders predict and graph data based on the color of jelly beans they think are in a handful. In this prediction lesson plan, 2nd graders will predict how many of each color jellybean are in a handful. Then they graph these...
Curated OER
Graphing Activity
In this probability and statistics worksheet, students work with a family member to construct graphs based on real life data. The two page worksheet contains three questions. Answers are not included.
Curated OER
Getting A Grip On Graphs
Fourth graders investigate the concept of graphing and comparing different types of data using pictographs, line graphs, scatter plots, etc... They gather data and make interpretations while examining the medium of how it is displayed.
Curated OER
Survey and Tally
Second graders view a model of a survey and tally. In this survey and tally lesson, 2nd graders decide on questions for a survey. Students conduct the survey and tally their results. Students create a tally chart....


