Worksheet Place
How I Get to School
Find out how many of your learners take the bus, how many walk, and how many bike with a quick survey. Class members gather data about how each individual gets to school and mark the results on this page in order to create a bar graph.
Curated OER
All About Graphs
Students practice organizing data by creating graphs. In this statistics lesson, students survey the class about favorite colors and create a bar graph using the data. Students complete a test based on pet and animal statistics.
Curated OER
The Gathering and Analysis of Data
Young mathematicians gather data on a topic, graph it in various forms, interpret the information, and write a summary of the data. They present their data and graphs to the class.
Curated OER
Student News And Weather Channel
Fabulous! Your 5th graders should love this project. As an ongoing lesson throughout the year students use temperature probes to record outside temperature and then document their data using spreadsheets. They use their weather data and...
Curated OER
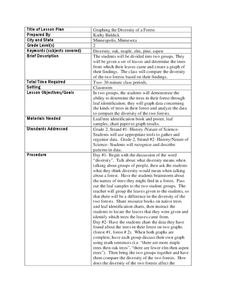
Graphing the Diversity of a Forest
Second graders work in groups to identify what types of trees create which types of leaves In this plant life lesson plan, 2nd graders analyze a set of leaves and identify the tree it came from while graphing the data in a science...
Curated OER
Jellybean Graphs
Second graders predict and graph data based on the color of jelly beans they think are in a handful. In this prediction lesson plan, 2nd graders will predict how many of each color jellybean are in a handful. Then they graph these...
Curated OER
Collecting and Analyzing Data
For this collecting and analyzing data worksheet, students collect data from an experimental investigation about the relationship between the color of a Tootsie Roll Pop and the time it takes to get to the chocolate center. ...
Curated OER
Using Matrices for Data
In this matrices for data worksheet, 9th graders solve and complete 29 various types of problems that include using matrices to illustrate data. First, they determine the sum, difference and scalar product for each matrices shown. Then,...
Curated OER
M & M Madness
M&M's are always a great manipulative to use when teaching math. In this graphing lesson plan, learners predict how many of each color of M & M's there are. They count up each color and plug the data into a graph using the...
Curated OER
Interpreting Medical Data
Students explore human anatomy by graphing scientific data. In this vision lesson, students discuss how ophthalmology works and take their own eye assessment test using the Snellen chart. Students collect vision data from all of their...
Curated OER
Reading the Neighborhood
First graders complete activities with the story One Monday Morning in the Macmillan/McGraw Hill Textbook. In this data lesson, 1st graders read the story and gather data to create a picture graph. They read the graph and answer...
Curated OER
Valentine Candy Count
Students analyze a bag of Valentine candy to create a graph. In this graphing lesson, students make predictions, sort by color, record data and make a graph. Students discuss results and make generalizations. Students generate their own...
Curated OER
Using Spreadsheets and Graphs
Third graders explore mathematics by utilizing computers. In this graphing lesson, 3rd graders gather class data based on a particular topic such as the "favorite candy" of the class. Students utilize this information and computers to...
Curated OER
Fast Food Survey Using Bar Graphs
Second graders conduct survey and sort data according to categories, construct bar graph with intervals of 1, and write a few sentences about their graphs.
Curated OER
M&M's and the Scientific Method
Sixth graders explore the scientific method by conducting an in class experiment. In this scientific averages lesson, 6th graders discuss the concept of the scientific method, and define the different mathematical averages, mean, median...
Curated OER
Pick a Pet
Students design informational materials to educate people on the importance of matching a new pet to the family's lifestyle and living arrangements. Students use critical thinking skills to make a decision on the appropriate choice for a...
Curated OER
Graphing Made Easy
Fourth graders discover the appropriate way to construct and analyze bar, line, picto, and circle graphs. They set up frequency tables and perform some statistical analysis (mean, median, and mode) on their data.
Curated OER
Statistical Pictures of School and Life
Students explore how mathematical data is used to summarize and illustrate everyday life. They apply mathematical concepts and skills to analyze data. Students conduct a five question survey of 50 people or more and graph the data.
Curated OER
Environmental Issues in Multimedia Presentation
Students investigate a community environmental issue. They document it using traditional scientific methods, digital photography, and videotaping. After collecting data, they graph the results. Students present their findings in a...
Curated OER
Is the Hudson River Too Salty to Drink?
Students explore reasons for varied salinity in bodies of water. In this geographical inquiry lesson, students use a variety of visual and written information including maps, data tables, and graphs, to form a hypothesis as to why the...
Curated OER
By Golly, By Gum
Students investigate the ingredients and creation of chewing gum. In this scientific method lesson, students make predictions about what will happen to the mass of a piece of gum as it is chewed by a human. Students graph the...
Curated OER
Three Little Kittens: Addition Booklet
Students explore math problem solving strategies while reading a nursery rhyme. In this addition lesson, students learn math skills such as solving simple equations, graphing data and extending patterns while reading The Three Little...
Curated OER
Pen Pals
Learners collect bird count data at their sites, and share and compare the data collected from two different schoolyards using computer technology.
Curated OER
Lesson Plan: The Net Neutrality Debate
Should Internet users who send data-heavy content pay higher fees than those who are involved in activities, like sending an email, that have less content? This question is at the heart of the Net Neutrality debate. After watching a PBS...


