Curated OER
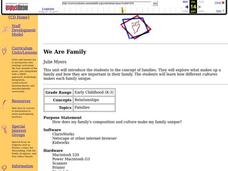
We Are Family
Students explore art and stories that depict families in different cultures. They examine how family members help each other, create traditions, have fun and change or grow. They describe their own families and create a class family...
Curated OER
Lesson Plan 1: Up, Down, Right, Left - Function Families
Students work in small groups to draw the trajectory of several scenarios. They label parts of the resulting parabola (vertex, axis of symmetry). Students complete four stations to explore quadratic functions.
Virginia Department of Education
Factoring for Zeros
Relate factors to zeros and x-intercepts. Scholars first graph quadratics in both standard and factored forms to see that they are the same. They go on to use the graphs to see the relationship between factors and x-intercepts.
Curated OER
Function Families
In this function families worksheet, learners graph 6 families of absolute value equations on a graphing calculator and transfer a sketch to graph paper. Students then answer 8 questions to identify the vertex.
Virginia Department of Education
Functions 1
Scholars learn what it means for a relation to be a function and see various representations of functions. After learning the definition, they participate in a card sorting activity classifying relations as functions or not.
Curated OER
You Sank My Battleship
Young scholars apply the concept of transformation to the game of battleship. In this algebra lesson, students relate their linear equations to how they would graph or set up their game pieces to win.
Curated OER
How Many People Live in Your Household?
Students create a pictograph showing household size for the class.In this data collection and graphing lesson, the teacher guides students through the creation of a concrete object graph, then students analyze and summarize the results.
Curated OER
1st Grade - Act. 14: Who's in Your Family
First graders create classroom graph of their family members after reading book, Family.
Federal Reserve Bank
The Output Gap: A‘Potentially’ Unreliable Measure of Economic Health?
How can we accurately estimate what the economy should produce now and in the future? Have your pupils tackle this question as they learn about real versus potential GDP and as they review data regarding the output gap in the United States.
Curated OER
Family Survey
In this mathematical worksheet, students survey fifteen people to find out how many people are in their family and then graph out their findings.
Curated OER
Practice Estimating!
Bring math home with this interative estimating worksheet! Scholars make educated guesses about the number of six household items: crayons in a crayon box, keys on a key ring, coins in a piggy bank, trees in the yard, pictures on the...
Radford University
A Change in the Weather
Explore the power of mathematics through this two-week statistics unit. Pupils learn about several climate-related issues and complete surveys that communicate their perceptions. They graph both univariate and bivariate data and use...
Curated OER
Vacation Values: A Math WebQuest
Fifth graders participate in a Math Web Quest to research two vacation options for their "families" in order to determine the best mathematical value for their family. They gather data, create two comparison graphs based on that data,...
PBS
U.S. Agricultural Subsidies and Nutrition
Most young people don't spend a lot of time thinking about why some foods cost less than others. This resource uses clips from the documentary, Food, Inc. to explore the impact of agricultural subsidies on nutrition, health, and the...
Virginia Department of Education
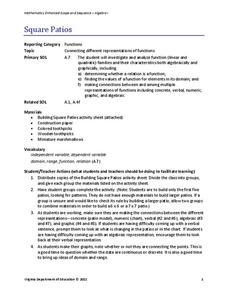
Square Patios
Build a patio from toothpicks and marshmallows to analyze functions! Learners look for patterns in the data as they create different size patios. As they discover patterns, they make connections between the different representations of...
Curated OER
Do I Need Insurance?
Explore the different types, costs, and coverage of insurance. High schoolers compare their family's health care to their income, compare the cost of health insurance to their expected future income, and make a choice about what type of...
Curated OER
Household Conservation/Efficiency
Hook your class up to an online home energy usage calculator so that they can estimate the amount used per month by their families. Then give them Watt meters with which they will measure the power consumption of several small...
Math Mammoth
Grade 1 Worktext
Use graphing, counting, and number lines to help first graders learn about addition and subtraction. An array of worksheets and activities are an excellent resource for your math lesson, whether you are focusing on counting skills or...
Curated OER
Lands That I Love
Students create a graph showing their family roots. They read about how immigrants can develop strong feelings for two countries. They discover the importance of their earliest memories.
Curated OER
Other kinds of groups- part 4 of 5
Students compare and contrast characteristics of groups. Students create graphs using various symbols of different groups. Students make maps of their neighborhood 'groups'.
Curated OER
Probability
Students complete various activities for probability. In this probability lesson, students use coins, cubes, peanut butter and jelly, playing cards, number cubes, darts, and a Gauss Curve to study probability. Students must orally...
Curated OER
Graphing and Demography: The Domestic Slave Trade
Students create graphs or charts based on the data a narrative imbedded in this plan. They make them either by hand or by using Excel or a similar database program. This lesson utilizes technology in a meaningful way.
Curated OER
Discovering Your Community
Students focus on the origins of the families that make up their community by exploring their family's origins through themselves, parents, and grandparents. Students create a map marked with family origins for the class.


