Curated OER
Angles Formed By Parallel Lines
Young scholars explore the concept of angles formed by parallel lines.They graph two parallel lines cut by a transversal, then measure the angles formed by the transversal and record the data in a table. Learners make conjectures about...
Curated OER
Introducing y = mx + b
Middle and high schoolers use the slope intercept form to graph a line. In this algebra lesson, pupils rewrite equations from standard form to y-intercept form. They use the slope and y-intercept to graph a line without making a table of...
Curated OER
Slopes, Slope-Intercept Form, Standard Form
Students identify the slope of an equation using various methods. In this algebra lesson, students graph linear equations and calculate the slopes using the x and y intercept to solve the equations and graph the lines. They use the slope...
Curated OER
Investigating Equations of Lines
High schoolers investigate linear equations as they use technology (Cabri, Jr.) to explore the equations of lines in slope-intercept form. The technology allows learners to manipulate the line and observe the changes in the parameters of...
Curated OER
Algebra 1, Unit 7, Lesson 8: Practice Finding the Equation of a Line
Students solve systems of linear equations by graphing. The introduction of the lesson asks students to work in pairs or small groups to graph a line when given two points. Students graph 14 equations on the same coordinate grid to...
Alabama Learning Exchange
Graphing Stations
Students explore the concept of graphing stations. For this graphing stations lesson, students head to various teacher set-up stations involving slope, point-slope, standard form, parallel lines, etc. Students work problems...
Curated OER
The Gathering and Analysis of Data
Young mathematicians gather data on a topic, graph it in various forms, interpret the information, and write a summary of the data. They present their data and graphs to the class.
Curated OER
Graphing My Path to Success
Seventh graders examine their school performance through self-assessment of strengths and weaknesses. They construct a line graph, plotting all courses and achievements. Students use graph paper and colored pencils for each activity. If...
Curated OER
How Long Can You Go?
Eighth graders examine the usefulness of a line of best fit by collecting and graphing data, using a graphing calculator to determine the line of best fit, and making a variety of predictions. They watch a video, then design a...
Curated OER
Profitable Soda Stand
Am I making any money? Help learners determine if their fictitious soda stand is turning a profit. They graph linear equations using the slope and y-intercept and identify the best price to use to sell soda. They identify the domain and...
Curated OER
Polar Graphs
Students graph polar graphs. In this calculus lesson, students convert between polar and rectangular coordinates. They graph their solution on the TI calculator and make observations.
Curated OER
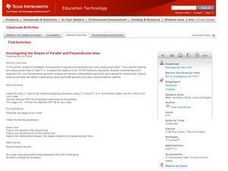
Investigating the Slopes of Parallel and Perpendicular Lines
High schoolers investigate parallel and perpendicular lines. They use Cabri Jr. to construct and explore the relationships between the slopes of parallel and perpendicular lines. The drawing and measurement tools available with Cabri Jr....
Utah Education Network (UEN)
Linear Graphs Using Proportions and Rates
Using a TI-73 or other similar graphing calculator middle school math majors investigate the linear relationship of equivalent proportions. After a brief introduction by the teacher, class members participate in a timed pair share...
West Contra Costa Unified School District
Point-Slope Application Problems
Create a linear equation for a problem when the intercept information is not given. The two-day lesson introduces the class to the point-slope form, which can be used for problems when the initial conditions are not provided. Pupils...
Curated OER
The Slope of a Line
Young scholars define the slope of a line as rate of change. They investigate positive, negative, zero, or undefined slope using a graphing calculator. They determine the slope of a line when given the equation of the line.
Curated OER
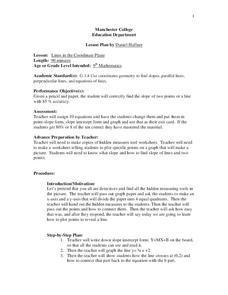
Lines in the Coordinate Plane
Students graph lines in a coordinate plane. In this geometry lesson, students graph lines on a coordinate plane, and identify the slope. They classify the lines as parallel or perpendicular and write an equation of a given line.
Curated OER
Chart Your Course
Students explore change represented in graphs comparing distance and time. They exchange and share their graphs. Students interpret and create distance versus time line-graphs, and write stories based on these graphs. They interpret a...
Curated OER
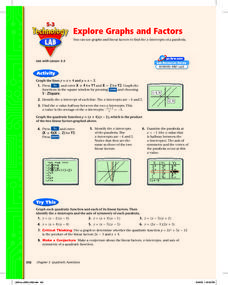
Explore Graphs and Factors
Pupils graph the factors of a quadratic as linear equations and graph the parabolic equation in factored form. Also, they investigate the relationship between the x-intercepts of the lines and the zeros of the parabola.
Curated OER
Writing Linear Equations in Slope-Intercept Form
In this math worksheet, students are given three lines graphed on a coordinate grid. Students identify the slope, intercepts, and write an equation for each. Students find the intercepts of a linear equation, and graph them. They write...
Curated OER
Linear Modelling of the Life Expectancy of Canadians
Middle and high schoolers explore the concept of linear modelling. In this linear modelling lesson, pupils find the line of best fit for life expectancy data of Canadians. They compare life expectancies of men and women, and find...
Curated OER
Modeling Linear Relationships
Students graph lines using the slope and y-intercept. In this algebra lesson, students create data using tables and equations. They use their data to make predictions and draw conclusion.
American Statistical Association
What Fits?
The bounce of a golf ball changes the result in golf, mini golf—and a great math activity. Scholars graph the height of golf ball bounces before finding a line of best fit. They analyze their own data and the results of others to better...
West Contra Costa Unified School District
Shifting Linear Equations in Function Notation
Time for a shift in thinking! Learners examine translations of linear functions. They use function notation to describe the translation and make connections to the graph.
Curated OER
Reading Graphs
Students practice plotting functions on the Cartesian coordinate plane, see several categories of functions, including lines and parabolas, and read a graph, answering questions about the situation described by the graph


