Curated OER
The Number Line
Learners graph and order numbers using a number line. They also solve word problems using fractions and decimals and rewrite equations to solve problems correctly. Several example word problems are given.
BW Walch
Creating and Graphing Exponential Equations
Frequently found in biology and economic application problems, exponential equations show up as stars in this introductory presentation. Taking no background or knowledge of exponentials for granted, the slides walk learners through the...
Curated OER
Building Sets of 13 and 14
Compose and decompose sets of 13 and 14 and compare sets of each with your little learners. They use objects to construct sets of 13 and 14, record their answers, and compare sets in several different ways.
Curated OER
Physical Setting: Physics Exam 2004
Twelve pages of mostly multiple-choice questions comprise this comprehensive New York Regents physics exam. It covers an entire year's worth of physics curriculum and requires about three hours for completion. Review the questions to...
Curated OER
Numbers and Me
Students collect and graph data about themselves. In this collecting and graphing data instructional activity, students poll their classmates about how many siblings they have or they measure their height. Students make a bar graph of...
Curated OER
Study Guide: Rational Numbers
In this rational numbers worksheet, students solve and complete 8 different problems that include applying the comparison property and density property for rational numbers. First, they replace each blank with the correct symbol to make...
Curated OER
Graphs to Represent a Data Set
By analyzing a word problem about hours worked in a week, scholars get valuable practice with bar graphs and data analysis. They read the scenario, then examine a table of data taken from it. The data includes four days and the...
Curated OER
Graphs to Represent a Data Set
Here are a some pre-made sets of data that kids can use to practice data analysis. There are 10 survey scenarios written out, and scholars synthesize the results of each into a bar graph. In addition to the graphing, they answer two...
Curated OER
Graphs that Represent Data Sets
Use these pre-made data sets to introduce kids to bar graphs and data analysis, and then have them take surveys on their own. There are 10 survey scenarios written out here, and scholars synthesize the results of each into a bar graph....
Curated OER
Graphs to Represent a Data Set
Here are Jack's hours for the week; scholars organize them into a bar graph in this data analysis worksheet. They write the days along the y-axis and hours along the x-axis. Encourage labeling for this. Consider projecting as an...
Curated OER
Trigonometric Form of Complex Numbers
This lesson is written from the perspective of a student teacher. A step by step lesson in which the class works on the trigonometric form of complex numbers. They convert between trigonometric and complex forms. They will also practice...
Alabama Learning Exchange
As If Numbers Weren't Complex Enough Already!
The class explores the concept of complex numbers on a website to generate their own Mandelbrot sets. They will practice performing operations with complex numbers and then to get a visual understanding, graph the absolute value of a...
Curated OER
Introduce Double-Digit Addition
Students generate a list of numbers then classify them into groups of single digit and double-digit numbers. After listening to a children's book about double-digit addition, they work with tens and ones blocks to solve double-digit...
Curated OER
How to Draw a Bar Chart Correctly
Your class has gathered their data, so what's the next step? They need to display and analyze their data, and a bar chart is a perfect tool for the job. This resource provides the step-by-step instructions those kids need to construct a...
Illustrative Mathematics
Assessing Writing Numbers
Can I say a number by its name, and can you write it for me? Working in small groups or with the whole class, give your kindergartners a piece of 1-inch graph paper and have them write numbers 0 to 10 and 11 to 20. Next, pass out blank...
Curated OER
Lesson 2-5: Absolute Value Functions and Graphs
What is absolute value? What is an absolute value function? Emerging mathematicians solve equations containing variables inside an absolute value sign. They graph each function on a coordinate plane and identify the maximum and minimum...
Heidi Songs
Zoo Animal Probability Graph
Capture the engagement of your young mathematicians with a collaborative graphing activity. Using a deck of zoo animal picture cards, students select a picture from the deck, record the chosen animal on a graph, and then replace the card...
EngageNY
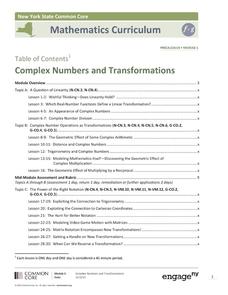
Complex Numbers and Transformations
Your learners combine their knowledge of real and imaginary numbers and matrices in an activity containing thirty lessons, two assessments (mid-module and end module), and their corresponding rubrics. Centered on complex numbers and...
National Security Agency
Going Green with Graphs
In this unit designed for second graders, youngsters are introduced to conducting surveys and creating tally charts based on the data they gather. Students then construct bar graphs, and observe the relationships between the two types of...
Curated OER
Fraction and Decimal Ordering
Ordering numbers just got physical! Learners practice putting numbers in sequence, both in fraction and decimal form. To begin, they line up in birthday order and discuss the difference between ascending and descending. They are then...
Curated OER
Graphing
Students collect data to create different types of graphs-line, pie, and bar graphs. They use StarOffice 6.0 to create graphs.
CK-12 Foundation
Limiting Factors to Population Growth: Graphing Population Growth
If any of the limiting factors in an environment change, both animal and plant populations also change. The video explains two different models of growth and the impact of limiting factors. It highlights the carrying capacity of an...
EngageNY
Real-World Positive and Negative Numbers and Zero
Class members investigate how positive and negative numbers are useful in the real world. Individuals first read a short passage and identify terms indicating positive and negative numbers. They consider situations involving positive...
EngageNY
Analyzing a Data Set
Through discussions and journaling, classmates determine methods to associate types of functions with data presented in a table. Small groups then work with examples and exercises to refine their methods and find functions that work to...


