Curated OER
Equations and Inequalities
Students in a college algebra class use graphs to solve inequalities. Using the coordinate graphing system, they represent the relationship between x and y intercepts. They practice solving equations with complex numbers and locate...
Curated OER
Graphing Linear Equations Using Data Tables
Students review the Cartesian plane and the process of plotting points. In groups, students create tables, identify the slope and y-intercept, and graph the equation. Afterward, students perform the same process, only, individually. As a...
Curated OER
Graph Logarithms
Mathematicians graph logarithmic equations. Teach your students how to identify the intercepts of logarithmic equations and tell whether the function is increasing or decreasing. They find the domain and range of each function.
Curated OER
Using Tables to Solve Linear Functions
Oh that intercept! Budding algebra masters solve linear equations from standard to intercept form. They identify the slope and y-intercept to help graph the lines, an then create coordinate pairs using a table of values. Great TI tips...
Curated OER
Reading a Graph: Azimuth Range vs. Day in Barrow Alaska
Learners practice reading a graph while doing story problems. They determine the x and y intercepts and calculate the slope. They also practice writing linear equations.
CPM
Zero Product Property And Quadratics
In this quadratics worksheet, students identify and solve 24 different problems and graphs that include using the Zero Product Property to complete. First, they define the Zero Product Property and its relation to quadratic equations....
Curated OER
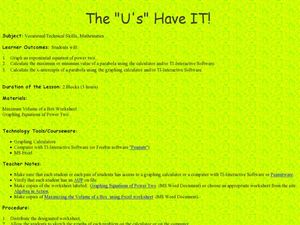
The "U's" Have IT!
Students explore the maximum and minimum values of parabola. In this exponential equations lesson, students use graphing calculators or TI Interactive Software to calculate values of parabola and graph x-intercepts of parabola.
Curated OER
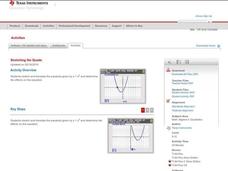
Stretching the Quads
Explore parabolas in this algebra lesson with the graphing calculator. The class investigates what effects the changing of the parameters of the vertex form of a quadrati have to its graph. They find the zeros of a quadratic graphically...
Curated OER
Linear Functions
Your learners will explore linear functions by analyzing a graph of the linear equations.Then learners analyze through calculating f(x+P) and g(x+p)
Wordpress
Introduction to Exponential Functions
This lesson begins with a review of linear functions and segues nicely over its fifteen examples and problems into a deep study of exponential functions. Linear and exponential growth are compared in an investment task. Data tables are...
Curated OER
Using Linear Models
For this Algebra II worksheet, 11th graders examine models whose behavior can be described by a linear function. The four page worksheet contains explanation of topic, three guided problems, and eight practice problems. ...
Virginia Department of Education
Transformation Investigation
Graph it! Investigate transformations with a graphing calculator. Pupils graph sets of linear functions on the same set of axes. They determine how changes in the equation of a linear function result in changes in the graph.
Curated OER
Slope, slope-Intercept Form and Standard Form
Students investigate and solve linear equations using slopes. In this algebra activity, students graph lines using the slope and y intercept. They also find the slope by rewriting their equation in to slope-intercept form from standard...
Curated OER
Graphing Equations
In this algebra worksheet, students solve linear equations through evaluations and graphing. There are 76 questions ranging from addition to division of linear equations.
Curated OER
Standard Linear Form
Ninth graders identify and describe the x-intercept as the place where the line crosses the x-axis as it applies to football. They create their own differentiations to reinforce the distinction between the x-intercept and the...
Curated OER
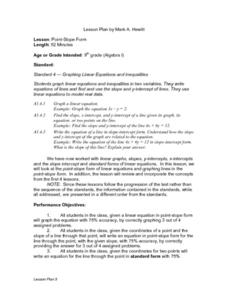
Point-Slope Form
Ninth graders explore the point-slope form of linear equations and graph lines in the point-slope form. After completing the point-slope equation, they identify the slope of a line through a particular point. Students explain the...
Curated OER
Introducing Linear Terminology
Ninth graders graph linear equations and inequalities in two variables and then, they write equations of lines and find and use the slope and y-intercept
of lines. They use linear equations to model real data and define to define the...
Curated OER
Graphing Linear Equations
In this linear equations worksheet, students graph linear equations on a coordinate plane. They identify the slope and the y-intercept. This five-page worksheet contains approximately 36 problems.
Curated OER
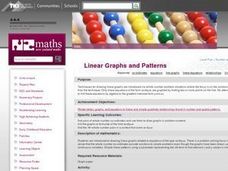
Linear Graphs and Patterns
Fifth graders find pairs of whole number co-ordinates and use them to draw graphs in problem contexts. They find and interpret the all meaningful pairs of whole number co-ordinates from graphs.
Virginia Department of Education
Slope-2-Slope
Pupils build on previous experience with slope to investigate positive, negative, zero, and undefined slope. They complete a puzzle matching slope-intercept and standard forms of linear equations.
Inside Mathematics
Squares and Circles
It's all about lines when going around. Pupils graph the relationship between the length of a side of a square and its perimeter. Class members explain the origin in context of the side length and perimeter. They compare the graph to the...
Mt. San Antonio Collage
Quiz 1: Functions, Domain and Range
Take the work out of worksheets and use these problems and worked-out answer key as a resource. The problems reinforce skills in domain and range, identifying graphs, and even and odd functions.
West Contra Costa Unified School District
Shifting Linear Equations in Function Notation
Time for a shift in thinking! Learners examine translations of linear functions. They use function notation to describe the translation and make connections to the graph.
Curated OER
Graphing of Functions Using First and Second Derivatives
In this calculus worksheet, students solve problems using the first and second derivatives. They define the behavior of the function based on the derivative. There are 11 questions with an answer key.


