Alabama Learning Exchange
The Big Bang Theory: An Evidence-Based Argument
What evidence supports the big bang theory? Individuals analyze scholarly resources about the the theory and develop arguments backed by evidence. They brainstorm, share ideas, watch a video, and read articles to complete a graphic...
Curated OER
Life Snapshots
Students create Inspiration webs using graphics or photographs that depict high and low points in their lives. This technology-based Language Arts instructional activity for the upper-elementary or middle-level classroom is excellent for...
Alabama Learning Exchange
Wheels All Around
Budding mathematicians explore the concept of skip counting. They practice skip counting as they use it to determine the number of wheels that come to school at 3 different times throughout the day. They also create a data graph to show...
EngageNY
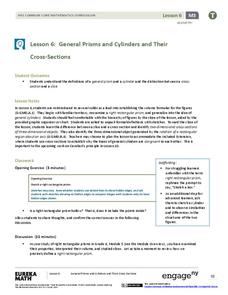
General Prisms and Cylinders and Their Cross-Sections
So a cylinder does not have to look like a can? By expanding upon the precise definition of a rectangular prism, the lesson develops the definition of a general cylinder. Scholars continue on to develop a graphical organizer...
EngageNY
Coordinates of Points in Space
Combine vectors and matrices to describe transformations in space. Class members create visual representations of the addition of ordered pairs to discover the resulting parallelogram. They also examine the graphical representation...
EngageNY
First-Person Computer Games
How do graphic designers project three-dimensional images onto two-dimensional spaces? Scholars connect their learning of matrix transformations to graphic design. They understand how to apply matrix transformations to make...
College at Brockport
Healthy Ecosystems
Is there a connection between the snowshoe hare population and the lynx population? Young scientists will examine this question and graph actual data to determine the relationship between these two species, as well as researching another...
EngageNY
Inferring from a Primary Source: Close Read of Colonial Times Inventory
Teach your class about colonial America through an examination of primary documents. First though, start vocabulary notebooks for content-specific and academic vocabulary. Pupils can keep this record during the entire module. Once this...
EngageNY
The Definition of a Parabola
Put together the pieces and model a parabola. Learners work through several examples to develop an understanding of a parabola graphically and algebraically.
EngageNY
Four Interesting Transformations of Functions (Part 4)
What do you get when you cross piecewise functions with transformations? An engaging lesson! The conclusion of a four-part series on the transformations of functions asks class members to apply transformations to piecewise...
EngageNY
Rational and Irrational Numbers
Back to the basics: learning how to add numbers. The 17th installment of a 35-part module first reviews addition techniques for rational numbers, such as graphical methods (number line) and numerical methods (standard algorithm). It goes...
EngageNY
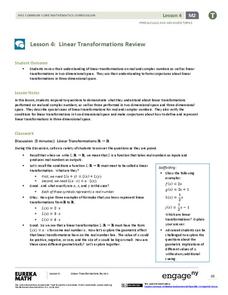
Linear Transformations Review
Time for matrices and complex numbers to come together. Individuals use matrices to add and multiply complex numbers by a scalar. The instructional activity makes a strong connection between the operations and graphical transformations.
EngageNY
Matrix Addition Is Commutative
Explore properties of addition as they relate to matrices. Using graphical representations of vector matrices, scholars test the commutative and associative properties of addition. They determine if the properties are consistent for...
EngageNY
Graphing Cubic, Square Root, and Cube Root Functions
Is there a relationship between powers and roots? Here is a lesson that asks individuals to examine the graphical relationship. Pupils create a table of values and then graph a square root and quadratic equation. They repeat the process...
Fuel the Brain
One Inch Scavenger Hunt
How many items can your learners find that are approximately one inch in length or width? Using this graphic organizer, they find nine, labeling and drawing each. A line that is 1-inch is provided at the bottom of the page, or you could...
Curated OER
Less and More Scavenger Hunt
Send your scholars on a measuring scavenger hunt with this interactive worksheet! They use a graphic organizer to record their findings as they search for items which are less than, more than, or just about one inch long. For each, they...
Weebly
Symbolism in The Giver
Take two days to examine the symbolism inherent in color, and how this relates to Lois Lowry's The Giver. Small groups first discuss the meaning of colors and then come together as a class to explore the impact of color. The activities...
CK-12 Foundation
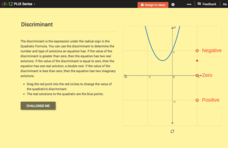
Discriminant
Discriminate between the types of roots. The interactive root introduces the discriminant and its connection to the types and number of roots. Pupils use a slider to view graphically the effect of the sign of the discriminant on a...
CK-12 Foundation
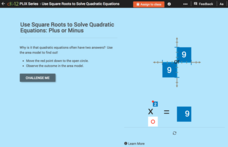
Use Square Roots to Solve Quadratic Equations: Plus or Minus
Get two answers from a single equation. Pupils use the interactive to take the square root of nine and see the graphical representation of the two solutions. Individuals realize that solutions to quadratic equations that are solved by...
CK-12 Foundation
Multiplying Polynomials
Help your class find patterns in polynomial multiplication. Pupils multiply a trinomial by a binomial using a graphic organizer. They respond to questions about patterns observed in polynomial multiplication before a discussion question...
CK-12 Foundation
Multiplication of Monomials by Polynomials: Distributing the Monomial
An interactive shows graphically the distribution of a monomial across all the terms in a polynomial multiplication problem. Pupils relate the specific example to a more general problem then make conclusions to develop a pattern for...
CK-12 Foundation
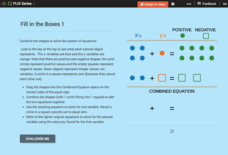
Linear Systems with Addition and Subtraction: Fill in the Boxes 1
Eliminate a color by dragging shapes. The interactive provides a graphical color display that allows for pupils to solve a linear system by elimination. Learners combine figures following set rules for positive and negative shapes. The...
CK-12 Foundation
Midpoint and Segment Bisectors: The Midpoint Formula
Let's meet in the middle. Given two points on the coordinate plane, pupils use the interactive to find the midpoint. The interactive provides a graphical display of the midpoint and the midpoint formula with the coordinates of the...
CK-12 Foundation
Basic Geometric Definitions: Collinear Constellations
The stars are aligned for a great interactive resource. The interactive contains a graphic of Ursa Major. Given a movable ray, pupils check to see if the three stars that make the handle are collinear. They investigate the...


