Curated OER
The Gathering and Analysis of Data
Young mathematicians gather data on a topic, graph it in various forms, interpret the information, and write a summary of the data. They present their data and graphs to the class.
Worksheet Place
How I Get to School
Find out how many of your learners take the bus, how many walk, and how many bike with a quick survey. Class members gather data about how each individual gets to school and mark the results on this page in order to create a bar graph.
Curated OER
Graph It with Coffee!
Students interview employers and employees at local coffee shops about sales and profits and create graphs comparing and contrasting information obtained about the businesses.
Curated OER
Exploring Careers
The world is full of possibilities for your ELLs. Help them explore their career options with a lesson that incorporates Internet research and expository writing. Not only will they learn more about their careers of choice, but both...
Curated OER
Graphing With Paper and Computers
Fourth graders construct bar graphs. In this graphing lesson, 4th graders create bar graphs in connection with the story, The Copycat Fish. After creating the initial graphs on paper, students use MS Excel to create graphs.
Curated OER
Which Graph is best?
Students use commercial software to organize and visually display data to draw conclusions; students use graphing software to create several types of graphs illustrating the number of each color of M&M's in one bag.
Curated OER
Being an Educated Consumer of Statistics
Students examine kinds of data used to report statistics, and create their own statistical report based on any of the four sources of media information (Internet, newspaper, TV, magazine).
British Council
Chocolate
Are you the biggest chocoholic? Scholars read text about people eating chocolate and sequence the text by putting them in order of who ate the most to least chocolate. They quiz classmates to discover who is the biggest chocoholic in the...
Curated OER
Balloon Ball Bounce
Young scholars investigate energy conversions. In this physical science lesson plan, students make balloon balls to better understand rebound and the law of conservation of energy. The young scholars will use there balloon balls in a...
Curated OER
Probability With a Random Drawing
Students define probability, and predict, record, and discuss outcomes from a random drawing, then identify most likely and least likely outcomes. They conduct a random drawing, record the data on a data chart, analyze the data, and...
Curated OER
Assimilation in America
Students, after reading the novel, "The Joy Luck Club," create a four question survey about assimilation in America. They each ask four members of their family or peers to take the survey. After data is collected, they create graphs and...
Curated OER
Just Graph It!
Students research presidential election voting results, and organize and interpret data on class graphs.
Curated OER
Spicy, Hot Colors
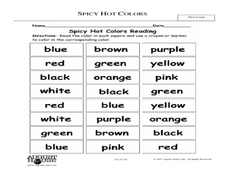
Students demonstrate an understanding of colors. In this visual arts lesson, students read the text Hot, Spicy Colors and name their favorite colors. Students complete a bar graph to show the data. Students discuss how each color can...
Curated OER
Table Interpretation
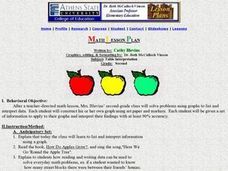
Pupils solve problems using graphs to list and interpret data. Each student construct his or her own graph using art paper and markers. They be given a set of information to apply to their graphs and interpret their findings.
Curated OER
If .... Then Probably
Students are introduced to the concepts of probability and chance. Using data given to them, they organize and create a chart to display the information. Using this chart, they calculate the percentage of chance and probability and...
Curated OER
Tony's Spelling Troubles
Students are introduced to the given problem and describe in their own words the situation represented in a bar chart and tally chart. They then use a bar chart and tally chart to make sensible predictions.
Curated OER
The Election Process
Students examine how Electoral College works, compare and contrast candidates or issues, and discuss importance of becoming registered, active voting individuals.
Curated OER
Roll with the Punches: Depression Era Machinery
Students construct models of simple and complicated machines with Legos. Then they design an experiment using the scientific method. ESE modifications included.
Curated OER
Historical Figures
Second graders identify a historical figure, his or her societal contributions and basic biography using a Kidspiration graphic organizer and library resources. They use the Internet to conduct an historical treasure hunt in groups.
Curated OER
Foods and Languages of the World
Learners review Mexico's location and language and learn to pronouns 10 new Spanish food words. Students listen as the book, Corn is Maize is read, touching and passing around an ear of Indian corn. Learners discuss the contribution of...
Curated OER
Classifying and Sorting
In this English worksheet, students add the suffix "ic". Students form adjectives by adding the suffix to nouns. Students choose the noun or adjective to complete the sentence.
Curated OER
E3 Ret Lesson Plan
Learners explore friction. For this physics lesson plan, students will cover metal blocks with film to determine the changes caused by static and kinetic friction.
Curated OER
The Statistics of Coins
Middle schoolers use skills of observation, recording, and calculation to provide an overview of years of cents (pennies) in circulation in the local area.
Other popular searches
- Graphing Data
- Data Analysis Graphing
- Data and Graphing
- Graphing Data Project
- Collecting and Graphing Data
- Graphing Data in Science
- Collecting Data Graphing
- Organizing and Graphing Data
- Mathematics Graphing Data
- Data Tables and Graphing
- Analyzing Data and Graphing
- Graphing Information


