Curated OER
Petro Products
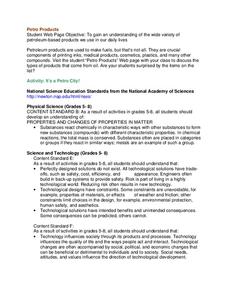
In this petroleum products activity, students are given the components of crude oil and they graph the various products found in a 50 gallon barrel. Students complete an activity to determine if they have collected cards that represent...
Curated OER
It's Your Life - Safe or Sorry/Safety Issues
Students examine and chart data about safety hazards and unsafe situations. In this safety hazard instructional activity, students examine newspapers and web sites to investigate injuries from safety hazards. They make a spreadsheet...
Education Institute
Four Mathematics Lessons for Grade 9
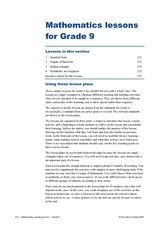
These four lesson plans build algebra skills for working with numbers in exponential form and for examining triangles. Be aware that in the text, scientific notation is referred to as index notation and the laws of exponents as the laws...
National Research Center for Career and Technical Education
Hospitality and Tourism 1: Safety and Sanitation
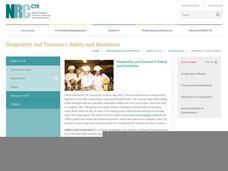
Math and science come alive in this career-related lesson plan on sanitation. Along the way, learners explore bacterial growth rates using exponential notation and graphs. A link to a very brief, but vivid video shows just how quickly...
PBS
Dear Pen Pal
Explore cultures from around the world with an engaging pen pal resource. Through a series of classroom activities and written correspondence, children learn about the favoritec pastimes, schooling, geography, and weather that is...
Teach Engineering
Quantum Dots and Colors
Introduce teams to quantum dot solutions with an activity that has them expose solutions to a blacklight, observe the colors, and take measurements. Groups graph the data and analyze the dependence between particle size and...
Noyce Foundation
Parallelogram
Parallelograms are pairs of triangles all the way around. Pupils measure to determine the area and perimeter of a parallelogram. They then find the area of the tirangles formed by drawing a diagonal of the parallelogram and compare their...
EngageNY
Tax, Commissions, Fees, and Other Real-World Percent Problems
Pupils work several real-world problems that use percents in the 11th portion of a 20-part series. The problems contain percents involved with taxes, commissions, discounts, tips, fees, and interest. Scholars use the equations formed for...
Illustrative Mathematics
Medieval Archer
This activity presents a problem about a computer game which uses functions to simulate the path of an arrow fired by an archer. Learners use the given function to determine where the archer must stand in order to fire an arrow that will...
Illustrative Mathematics
Color Week
Practice counting by ones up to 20 with your kindergartners using this colorful class experiment. There are two versions for the activity. Version 1: The Friday beforehand, send home a notice for the week assigning a different color for...
Chapman University
Point-Slope Formula for a Straight Line
Single-page poster showing the point-slope formula and its graph. Put this up on the wall of your math room or use as a handout. This clearly displayed graph and algebraic explanation will get your charges thinking about what is it...
Curated OER
Two Points Determine an Exponential Function II
Your algebra learners will build an exponential equation given a graph with two specific points labeled.
Curated OER
Gapminder World 2012
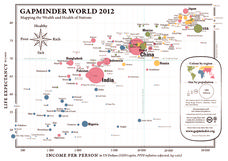
Here is a very interesting infographic that compares the average life expectancies, per capita incomes, and population sizes of every country in the world in 2012.
Mathematics Vision Project
Module 1: Functions and Their Inverses
Nothing better than the original! Help your class understand the relationship of an inverse function to its original function. Learners study the connection between the original function and its inverse through algebraic properties,...
University of Georgia
Splat!
What does viscosity have to do with splatter? An activity shows that the viscosity of a substance is inversely proportional to the distance of its splatter. Learners conduct the experiment by collecting data, graphing, and analyzing...
CK-12 Foundation
Linear Programming: Bakers' Dilemma
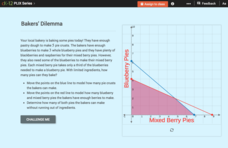
Place the pies in a line. Pupils create a graph of a system of linear inequalities to represent the number of pies a bakery can make. Learners analyze the vertices on the graph to determine the number of pies they can bake without...
CK-12 Foundation
Problem-Solving Models: Subway vs. Taxi
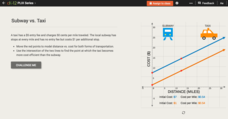
Ride to success in understanding systems of equations. Scholars graph a system of equations on the cost of a subway and a taxi using an interactive. Using this graph allows users to answer some questions about the situation.
CK-12 Foundation
Types of Data Representation: Baby Due Date Histogram
Histograms are likely to give birth to a variety of conclusions. Given the likelihood a woman is to give birth after a certain number of weeks, pupils create a histogram. The scholars use the histogram to analyze the data and answer...
CK-12 Foundation
Restricted Domain and Range: Translation of a Curve
Moving the graph of a function obviously changes its domain and range. Scholars adjust the location of a graph in an interactive coordinate plane. The interactive automatically updates and displays the domain and range to show how it...
CK-12 Foundation
Even and Odd Functions and Function Symmetry: Even and Odd Functions (Symmetry)
Even money states that the resource is good to use. Scholars manipulate an interactive to adjust the portion of a graph to the left of the y-axis. The interactive allows them to switch between even and odd modes that show the right side...
CK-12 Foundation
Mode: Boxes of Oranges
See how your data stacks up. Pupils stack crates of oranges in increasing order, creating a simple bar graph. Using the graph, individuals determine measures of center and describe the shape of the distribution. Scholars determine what...
CK-12 Foundation
Existence: One-to-One Functions and Inverses
One-to-one means the answer is simple, right? Given four graphs, pupils use a vertical line to test each graph to find out if they are one-to-one. By using the resource, learners realize that not all one-to-one relations are functions....
Curated OER
Conservation of Energy
Fifth graders examine their use of energy over a certain time period. They come up with a plan to reduce their energy consumption and carbon footprint. Groups of learners complete a chart with three columns; energy-using events, the form...
Curated OER
Rates of Chemical Reactions-The Iodine Clock Reaction
Learners investigate the reaction rate of iodine and soluble starch. In this rates of chemical reactions lesson plan, students study the effects of varying concentrations of reactants and varying temperatures of reactants on the reaction...
