CK-12 Foundation
Ski Jump
What are the three types of energy a ski jumper uses? If you said potential, kinetic, and heat, then you are correct. Scholars adjust the jumper's mass, jumper's form, and height of the start line in the simulation to display graphs of...
Los Angeles County Office of Education
California State Standards: Algebra I
Starting a year of Algebra I? This mighty packet practices all of the major topics with different ranges of difficulty. Standards include everything from linear to quadratic to rational expressions. Use it in a...
Mathalicious
Out of Left Field
A baseball trajectory and a parabola seem to make the best pair in real-world quadratic applications. Here is a current baseball resource with questions, discussions, and explorations regarding a quadratic function and home run...
Curated OER
Ornithology and Real World Science
Double click that mouse because you just found an amazing lesson! This cross-curricular Ornithology lesson incorporates literature, writing, reading informational text, data collection, scientific inquiry, Internet research, art, and...
Curated OER
da Vinci: Body Proportion Theories
Middle schoolers investigate the validity of da Vinci's proportion theory by recording human measurements on scatter plots. In groups of three, they record each other's height and wingspan to create a Powerpoint presentation, chart, or...
Curated OER
To Recycle, or Not Recycle?
To recycle or not to recycle, that is the question. Your class can find the answer by taking a teacher created WebQuest, where they assume a role of a community member taking a stand on implementing a community wide recycling plan. The...
Curated OER
8.SP.1Texting and Grades I
Here is a fitting question for middle schoolers to consider: Is there a relationship between grade point average and frequency of sending texts? Starting statisticians examine a scatter plot and discuss any patterns seen.
Math Guy
Algebra 1 Practice Final
What makes this resource special? The amazing answer key that comes with worked out solutions and notes for each problem. Practice problems include all topics ranging from linear systems to simplifying exponential expressions. The...
Curated OER
Linear Inequalities in Two Variables
Use this worksheet as a warm up, a refresher exercise, or a practice after a more detailed lesson on graphing linear inequalities in two variables. Start with boundaries that are horizontal or vertical, then move into graphs with...
Illustrative Mathematics
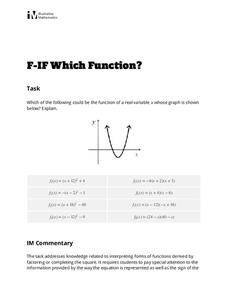
Which Function?
Learners are given a graph of a parabola on a coordinate system, but intercepts and vertex are not labeled. The task is to analyze eight given quadratic functions and determine which ones might possibly be represented by the graph. The...
Curated OER
Solving Absolute Value Inequalities
Start this activity with a brief description of how to solve absolute value inequalities. A space is provided to help classify the inequalities into types (greater than, less than, or equal to) and for learners to show how to graph their...
Illustrative Mathematics
Two Lines
Here is a resource that helps your algebra learners understand the connection between the graph of two lines, the equations of lines, and the solutions and intersecting points of lines. It would make a great assessment question, but can...
Curated OER
Am I Straight
Identify the slope of a linear equation in this algebra lesson. Middle schoolers graph linear equations using slopes and intercepts. They identify the slope as being positive, negative, no slope, or undefined.
Curated OER
Secant and Tangent Lines
Twelfth graders recognize the use of the slope of the secant line and connect it with the graph of the secant line, as the secant line approaches the tangent line. They also recognize the two forms of the slope formula used and practice...
Curated OER
Converting Fractions to Decimals
Seventh graders take a simple fraction and give it decimal form either by the use of equivalent fractions or division with a calculator.
Curated OER
Mmm, Mmm, M&M's
Here is another version of the classic M&M math lesson. In this one, upper graders utilize the ClarisWorks Spreadsheet program in order to document the data they come up with from their bags of M&M's. After making their initial...
Curated OER
Fraction and Decimal Ordering
Ordering numbers just got physical! Learners practice putting numbers in sequence, both in fraction and decimal form. To begin, they line up in birthday order and discuss the difference between ascending and descending. They are then...
Curated OER
Data Analysis of Ground Level Ozone
Sixth graders construct and interpret graphs from ozone data collected in Phoenix area. Can be adapted to other areas.
Curated OER
Giving and Taking Directions
High schoolers write set of written directions from their craft area in either chart or paragraph form, and give the directions orally to a third party who will listen to the directions and complete the task.
Curated OER
Class Presentation on Coal
Did you know that coal was formed from plants? After being assigned a coal-related topic, groups gather, organize, and present information about this energy source. The presentations should include visuals like graphs, charts, tables,...
Curated OER
Polynomials Functions
High schoolers factor polynomials and linear functions and apply concepts of the fundamental theorem of algebra to solve problems. They graph their solutions and analyze the graph.
Curated OER
Drug Sales Soar - Rate of Change
In this prescription drug worksheet, students answer short answer questions and create graphs on the sales of prescription drugs over a five year span. Students complete six questions.
Curated OER
Quadratic Equations
In this algebra worksheet uses factoring to solve and graph quadratic equations. The three page worksheet contains explanation of topic, worked examples and five practice problems. Answers are not provided.
Curated OER
Worksheet 25
In this math worksheet, pupils draw a graph of functions on a polar graphing system. They graph two functions by first plotting them on the vertical axis as a function of a given angle, then by plotting them at a radial distance from the...


