Curated OER
Nutrition and Food Security
Examine the three basic nutrients and their effects on the body. Fifth graders will research data to construct a bar graph and then demonstrate the relationship between malnutrition and food security. This is a very comprehensive...
Curated OER
Making Logic Out of Madness
Tenth graders organize and interpret data from a student health program. In this physical education lesson, 10th graders use a body composition analyzer over 8 weeks to determine the validity of a student health program. ...
Curated OER
Apple Adjectives
Study different apple varieties and use appropriate adjectives to describe them. Learners alphabetize both the apple names and the adjectives before creating spreadsheet, bar, and pie graphs. A mix of language arts, technology, and...
Curated OER
Heart Smart in a Heart Beat
As an introductory activity, young statisticians measure their heart rate at rest and after exercise and compute the mean and median, and create a box & whisker plot. This is followed by watching a video (that no longer seems...
Curated OER
It's Your Life - Safe or Sorry/Safety Issues
Students examine and chart data about safety hazards and unsafe situations. In this safety hazard instructional activity, students examine newspapers and web sites to investigate injuries from safety hazards. They make a spreadsheet...
Curated OER
Lesson 3: Vary Your Veggies and Focus on Fruits
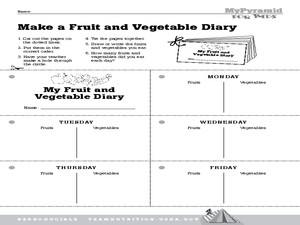
Students explore fruits and vegetables. In this nutrition instructional activity, students generate a list of all known fruits and vegetables. Students cut out and compile pages for a weekly fruits and vegetable...
Curated OER
Breathing Rates and Exercise
Students work in groups to predict which condition produces more breaths per minute. Groups record their breathing rates during rest periods and periods of activity. They graph their results and make comparisons to their predictions.
Curated OER
Graph Around the Room
Students discuss the importance of taking care of their bodies. They brainstorm ways to take care of their bodies. They create a graph.
Curated OER
Now That's Using Your Head!
Explore linear measurement. Scholars will measure the circumference of their head and the distance they can jump. Information is recorded, averages are calculated, and a data table is completed. They then determine possible relationships...
Curated OER
Crunching the Numbers on Dating Violence
Students read about potential violent relationships and beliefs about dating. For this relationship lesson students use graphs to examine data about healthy realtionshipsand draw conclusions on their results.
Howard Hughes Medical Institute
Virus Explorer
Most pupils know about the flu, HIV, and other viruses, but they don't know what each actually looks like. This interactive shows their relative size, structure, and allows for comparisons. It stresses the similarities and differences...
Curated OER
Sleep Central
First graders explore healthy and unhealthy sleeping habits. They make a class graph of the total number of hours students, as a class, sleep for the week.
Curated OER
Washing Hands
Students read stories, conduct experiments and create graphs as they consider the importance of proper hygiene in maintaining their health. They identify the best way to wash hands and design handwashing posters for classroom placement.
Curated OER
Diabetes - It's a Killer!
Learners survey, graph and chart their prior knowledge about diabetes. They read a handout and complete a K-W-L chart. They develop a rubric to assess their diet and exercise and develop a shopping list, menu and exercise plan to share.
Curated OER
Pie Charts
Students create their own pie chart about their total health, being comprised of physical, social, and mental health. They label each section physical, social, and mental, and label each section with the percentage they are trying to...
Curated OER
Stats on Reduced-Fat
Young scholars demonstrate an understanding of the Five-Number Summary and Box-Plots after analyzing data from nutrition labels, forming a hypothesis and supporting it. They decide if there is a significant difference between reduced fat...
Curated OER
Visual Representation of Reduced Fat
Middle schoolers demonstrate their understanding of the Five-Number Summary and Box-Plots by analyzing different nutrition labels from regular and reduced fat items using graphing calculators.
Curated OER
The Great Chile Challenge
Fifth graders gather data, create a graph, and interpret information. They build vocabulary by negotiating the ideas that go into the graphs which they create. They use Excel to print a variety of graphs based on how much they like Chile...
Curated OER
Healthy Foods
Pupils illustrate their favorite food and add it to a food pyramid graph, after listening to Russell Hoban's story, Bread and Jam for Frances.
Missouri Department of Elementary
What Are Bullying and Harassment? Part 2
After reviewing notes from the previous lessons, small groups obtain a scenario card that describes a situation in which bullying is happening. Peers discuss the event and brainstorm two solutions using the STAR method then present their...
Missouri Department of Elementary
STAR Deputies
Scholars become STAR deputies in a lesson that encourages them to be problem-solvers. Small groups gather to complete a worksheet by answering questions. A discussion presents a scenario in which a problem occurs on the playground. Small...
Missouri Department of Elementary
STAR Deputies, Unite!
STAR deputies unite! Scholars gather in small groups to solve problems using the STAR method. Pupils read a card that describes a situation that requires problem-solving. They role-play the scenario in front of their peers.
Missouri Department of Elementary
Dealing with Peer Influence: What Are Bullying and Harassment?
Scholars examine examples of peer pressure and discuss how specific actions negatively affect one's well-being. Learners gather in small groups to write two scenarios in which peer pressure is used. They reference the STAR method in how...
Curated OER
Drug and Alcohol Awareness
Fourth graders examine the statistics when it comes to teens and drug and alcohol abuse. In groups, they research the side effects of four different drugs. Using the information, they perform a skit, or puppet show to share their data...


