Curated OER
Solving Systems by Graphing
In this Algebra I/Algebra II worksheet, learners solve a system of linear equations by graphing. The one page worksheet contains one problem. Answer is provided.
Curated OER
It's OK to Reach Your Boiling Point!
Young scholars view a video which introduces them to density and the states of matter. They experiment, collect data, and graph the boiling/freezing points of several edible items...and then make brownies!
Curated OER
Changing State
Students investigate the cooling and heating of water. In this online science experiment lesson, students work in groups to make predictions regarding freezing and boiling points and then test those predictions as they complete the...
Curated OER
Using a Graph to Solve a System of Linear Equations
In this Algebra I/Algebra II activity, learners use graphing to solve a system of linear equations. The one page activity contains one multiple choice question. Answer is included.
Curated OER
Conics and Graphing
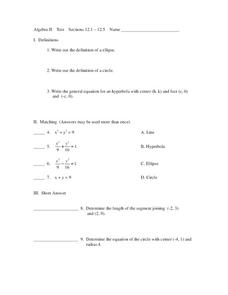
In this algebra worksheet, students solve equations by graphing an ellipse, circle and hyperbola. They match equations to graphs and define each type of function. There are 20 questions total.
Curated OER
Plot the Coordinates
In this geometry skills learning exercise, students plot the listed coordinates on the provided graphs to create letters of the alphabet.
Curated OER
Grids
In this geometry worksheet, students plot and label 8 sets of points and triangles on a grid using coordinate pairs. They use both positive and negative numbers.
Curated OER
Graphing Ordered Pairs
In this math worksheet, students learn to graph ordered pairs. Students examine a graph with 3 labeled points and tell the ordered pairs for each. Students also plot 8 ordered pairs on a graph they draw themselves.
Curated OER
Worksheet 6, Graphing Functions
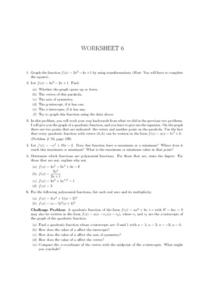
In this algebra worksheet students graph a given function by completing the square. They analyze a function and tell the axis of symmetry, the intercepts, and vertex. Students identify the maximum or minimum of a graph. Students identify...
Curated OER
Coordinate Graphing
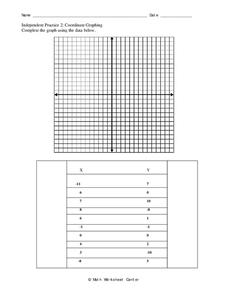
In this coordinate graph activity, 10th graders graph and complete 10 pairs of numbers on the illustrated gird. They graph each x point and label it on the graph. Then, students graph each y point listed on the graph and label those points.
Curated OER
Graphing Integers On a Coordinate Plane
Seventh graders explore the concept of graphing integers on a coordinate plane. In this graphing integers on a coordinate plane lesson plan, 7th graders discuss scenarios where coordinate systems are used in real life. Students...
EngageNY
Characteristics of Parallel Lines
Systems of parallel lines have no solution. Pupils work examples to discover that lines with the same slope and different y-intercepts are parallel. The 27th segment of 33 uses this discovery to develop a proof, and the class determines...
BW Walch
Solving Systems of Linear Inequalities
One thing that puzzles a lot of young algebrists is the factors in a word problem that are taken as "understood". This presentation on solving systems of linear inequalities does a great job walking the learner through how to tease those...
Charleston School District
Pre-Test Unit 6: Systems
As if solving equations with an x isn't tricky enough, now they add a y, too? A pre-assessment gauges the knowledge of your classes related to systems. They are asked to solve graphically and algebraically and to solve word...
EngageNY
The Slope of a Non-Vertical Line
This lesson introduces the idea of slope and defines it as a numerical measurement of the steepness of a line. Pupils then use the definition to compare lines, find positive and negative slopes, and notice their definition holds for...
EngageNY
Another Computational Model of Solving a Linear System
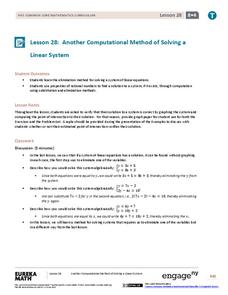
The process of elimination really works! Use elimination when substitution isn't doing the job. The 29th segment in a series of 33 introduces the elimination method to solving linear systems. Pupils work several exercises to grasp the...
Concord Consortium
Here Comes the Sun
Many phenomena in life are periodic in nature. A task-based lesson asks scholars to explore one of these phenomena. They collect data showing the sunrise time of a specific location over the period of a year. Using the data, they create...
CCSS Math Activities
Smarter Balanced Sample Items: 8th Grade Math – Claim 4
A math model is a good model. A slide show presents 10 sample items on modeling and data analysis. Items from Smarter Balanced illustrate different ways that Claim 4 may be assessed on the 8th grade math assessment. The presentation is...
Shodor Education Foundation
Data Flyer
Fit functions to data by using an interactive app. Individuals plot a scatter plot and then fit lines of best fit and regression curves to the data. The use of an app gives learners the opportunity to try out different functions to see...
CCSS Math Activities
Smarter Balanced Sample Items: 8th Grade Math – Claim 3
Communication is the key. A dozen sample items require scholars to communicate their reasoning involved in arriving at a solution. The PowerPoint from the Gr. 8 Claim 2 - 4 Item Slide Shows series uses a variety of content to...
EngageNY
Tides, Sound Waves, and Stock Markets
Help pupils see the world through the eyes of a mathematician. As they examine tide patterns, sound waves, and stock market patterns using trigonometric functions, learners create scatter plots and write best-fit functions.
Concord Consortium
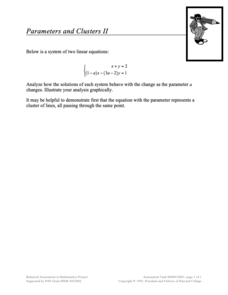
Parameters and Clusters II
Let's give parameters a second try. Scholars take a second look at a system of linear equations that involve a parameter. Using their knowledge of solutions of systems of linear equations, learners describe the solution to the system as...
PBS
Data Plots of Exoplanet Orbital Properties
Scientists discovered the first exoplanet in 1995 and by early 2018, they confirmed the existence of more than 3,700—that's a lot of data! As part of the PBS 9-12 Space series, scholars interpret data about exoplanets. They compare...
CCSS Math Activities
Smarter Balanced Sample Items: High School Math – Claim 3
Communication is the key. A presentation provides 25 sample items for Claim 3, Communicating Reasoning, for the Smarter Balanced High School Math assessment. Items require pupils to answer the question and provide logical reasoning to...
Other popular searches
- Graphing Points Picture
- Graphing Points Activity
- Art From Graphing Points
- Graphing Points on a Grid
- Halloween Graphing Points


