Education Development Center
Points, Slopes, and Lines
Before graphing and finding distances, learners investigate the coordinate plane and look at patterns related to plotted points. Points are plotted and the goal is to look at the horizontal and vertical distances between coordinates and...
Ohio Literacy Resource Center
Solving Systems of Linear Equations Graphing
Do you need to graph lines to see the point? A thorough lesson plan provides comprehensive instruction focused on solving systems of equations by graphing. Resources include guided practice worksheet, skill practice worksheet,...
Illustrative Mathematics
Who Has the Best Job?
Making money is important to teenagers. It is up to your apprentices to determine how much two wage earners make with their after school jobs. Participants work with a table, an equation, and a graph and compare the two workers to see...
Mathematics Assessment Project
Cubic Graph
Connect cubic graphs to equations. After connecting solutions of a cubic equation to zeros of its related cubic function, pupils investigate a translation of the cubic function.
Curated OER
Walking the Plank
This is a cool math activity. Kids collect and interpret data based on a physical act. A board is balanced between a scale and a step, learners record a peer's weight as it decreases while s/he walks further away from the scale. They...
Curated OER
Locate Points on a Grid: Practice
In this ordered pairs worksheet, students use the graph and write the letter of the point for each ordered pair. Students then write the ordered pair for the given points. Students then answer the six grid location questions.
Curated OER
Algebra I - Worksheet G12: Graphing Lines
In this graphing lines worksheet, high schoolers graph 28 lines given various data. Students graph lines given two points, a point and slope, and a line perpendicular or parallel to a point.
Curated OER
Points on a Graph
In this points on a graph worksheet, students are given the coordinates and they have to plot the points and connect the dots. Students plot 8 points on the graph.
Curated OER
Line Graphs
In this line graphs worksheet, 8th graders solve and complete 20 different problems that include reading various line graphs. First, they use the information provided in each line graph to determine the correct response to each of the...
Curated OER
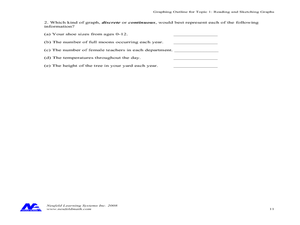
Reading and Sketching Graphs
For this graphs worksheet, learners answer 15 multistep questions about graphs. Students determine distance traveled, time, velocity, and create scenarios to fit the graph.
Illustrative Mathematics
Transforming the Graph of a Function
Function notation is like a code waiting to be cracked. Learners take the graph of an unknown equation and manipulate it based on three different transformation changes of the function equation. The final step is to look at three points...
EngageNY
Drawing the Coordinate Plane and Points on the Plane
To plot a point in the coordinate plane, you first need a coordinate plane. Pupils learn to draw an appropriate set of axes with labels on a coordinate plane. They must also determine a reasonable scale to plot given coordinate pairs on...
EngageNY
Constant Rate
Two-variable equations can express a constant rate situation. The lesson presents several constant rate problems. Pupils use the stated constant rate to create a linear equation, find values in a table, and graph the points. The resource...
CK-12 Foundation
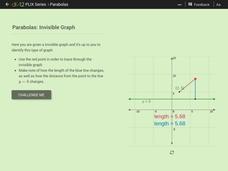
Parabolas: Invisible Graph
Envision the function as the point swings. Given a point connected to another point and a line, pupils trace through an invisible graph. Learners identify the name of the given point and the line and determine the type of conic section...
Teach Engineering
Maximum Power Point
Investigate the maximum power output of a photovoltaic panel with a lesson that introduces the class to the maximum power point. Individuals learn how to determine the maximum power point of a solar panel by using Ohm's law and the power...
Math Drills
Christmas Cartesian Art Snowflake
A festive math worksheet hones graphic skills and keeps the season bright! Young mathematicians join points in the order they were graphed to create a snowflake picture.
Yummy Math
A Cardioid for Valentine’s Day
It's Valentine's Day in geometry class! Celebrate the day of love with a heart-themed activity in which young mathematicians create a cardioid on polar graph paper.
EngageNY
Analyzing a Graph
Collaborative groups utilize their knowledge of parent functions and transformations to determine the equations associated with graphs. The graph is then related to the scenario it represents.
Balanced Assessment
Bathtub Graph
Represent the relationship between independent and dependent variables through a modeling situation. The activity expects learners to graph the volume of water in a bathtub during a given scenario. The graph should result in two areas of...
CK-12 Foundation
Graphs in the Coordinate Plane: Functions on a Cartesian Plane
Connect the dots to graph a linear function. Young mathematicians use an interactive to first plot provided points on a coordinate plane. They connect these points with a line and then answer questions about the slope and y-intercept of...
CK-12 Foundation
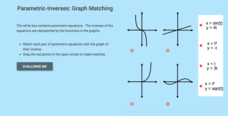
Parametric-Inverses: Graph Matching
Perform a switch to find the inverse of a parametric equation. Pupils match four parametric functions with the graph of the their inverses. Using the graphs, learners determine whether particular points are on the original parametric...
Flipped Math
Unit 1 Review: Analyze Graphs and Expressions
Get in one last practice. Pupils work through 12 problems and a performance task to review the topics in Unit 1. The problems cover analyzing and modeling with graphs, algebraic properties of equality, and adding, subtracting, and...
EngageNY
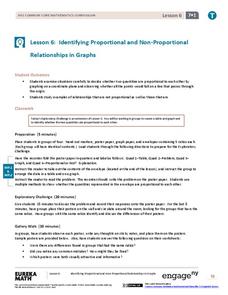
Identifying Proportional and Non-Proportional Relationships in Graphs 2
Work together to find proportional relationships. The sixth portion of the 22-part unit is a collaborative exercise. Teams work with given representations of relationships and determine if they are proportional by creating tables and...
CK-12 Foundation
Function Rules based on Graphs: Making Money in the Hat Business
Hats off to those learning about the graphs of functions. Individuals use an interactive to plot points representing profits for a hat business. They identify a quadratic equation to represent this function and answer challenge questions...
Other popular searches
- Graphing Points Picture
- Graphing Points Activity
- Art From Graphing Points
- Graphing Points on a Grid
- Halloween Graphing Points


