Curated OER
Earth on the Earth
Fourth graders plot points on a graph and transfer those coordinates onto a large scale model resulting in an outline of the Western Hemisphere. They identify the major geographical landforms of the Western Hemisphere.
Curated OER
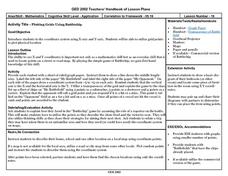
Plotting Grids Using Battleship
Learners coordinate grid points on X and Y axises to plot a physical location. The game of "Battleship is used to present first hand knowledge of this skill.
Curated OER
Coordinate Geometry
Grab your class and get them graphing polygons on a coordinate plane! They investigate the four quadrants, discover the x and y axis, and correctly plot ordered pairs. To show their comprehension, each child creates a coordinate picture...
Mathed Up!
Cumulative Frequency and Box Plots
Learn how to display data. Young data analysts watch a video to review how to create cumulative frequency histograms and box plots. They work on a set of questions to practice producing these data displays.
Curated OER
School Sleuths Treasure Map
Students are explained how a grid and compass work. They are also explained that archaeologists use grids as a record of the exact location of artifacts. Students define the term datum as a point of reference on grids from which all...
Curated OER
Graphing Integers
Fifth graders complete an integer graphing activity. In this integer graphing lesson, 5th graders use coordinate grids to help them complete linear functions and integer graphing.
Curated OER
How Much Will I Spend On Gas?
Students construct a linear graph. In this graphing lesson, students determine a monthly budget for gasoline. Students construct a t-chart and coordinate graph to display data. Resources are provided.
Curated OER
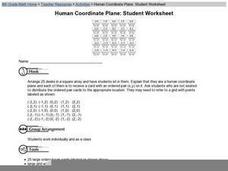
Human Coordinate Plane: Student Worksheet
An excellent way to teach the basics of coordinate graphing is here for you! Young mathematicians take on the identity of one of the two numbers in a coordinate pair, and the entire class must arrange themselves in the proper order. This...
Curated OER
Explorations 5: Introduction to Limits
In this limit worksheet, students find the interval values of given functions. They identify constants, and plot graphs. This three-page worksheet contains approximately 20 problems.
Curated OER
Linear Equations
Seventh graders explore battle plans using grids. In this linear equation instructional activity, 7th graders see how math is used in battle. Students create a grid on the floor using tape and plastic army men to serve as the...
Mathematics Vision Project
Module 6: Congruence, Construction, and Proof
Trace the links between a variety of math concepts in this far-reaching unit. Ideas that seem very different on the outset (like the distance formula and rigid transformations) come together in very natural and logical ways. This...
Code.org
Sending Numbers
Binary graphing ... bit by bit. Pairs work together to develop a protocol in order to send the points of a graph. One partner sends the points and the other receives them and tries to recreate the graph. The pupils use the rubric to...
Curated OER
Mathematical Modeling
Study various types of mathematical models in this math lesson. Learners calculate the slope to determine the risk in a situation described. They respond to a number of questions and analyze their statistical data. Then, they determine...
Curated OER
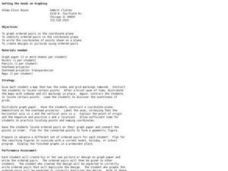
Getting the Goods on Graphing
Students explore graphing. For this math lesson plan, students graph ordered pairs in the coordinate plane, write the coordinates of points shown on a plane, and create designs or pictures using ordered pairs.
Curated OER
Graphing Linear Equations
In this calculator active graphing worksheet, students graph 12 equations via a calculator and transfer the graphs onto coordinate grids.
Curated OER
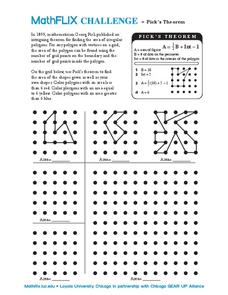
Pick's Theorem
In this Pick's Theorem worksheet, students solve and graph 6 different problems that include using Pick's Theorem to solve. First, they use Pick's Theorem to determine the area of the shapes given as well as their own shapes drawn. Then,...
Curated OER
Inequality Shading Investigation
In this inequality instructional activity, students graph the inequality of a line. They list ten integer coordinates that lie on the grid. Students explore their findings and answer thought questions. They shade the graph to indicate...
Curated OER
Battle Ship
In this coordinate plane worksheet, 10th graders solve and graph 3 different problems that include playing a game with graphing. First, they mark one of each of they ships either horizontally or vertically. Then, students call out a...
Curated OER
Writing Coordinates
In this writing coordinates worksheet, students solve and graph 6 different problems related to writing various coordinates on the graph. First, they move to the right and up on the grid, naming the point found. Then, students move up or...
Curated OER
A Christmas Place
In this graphing worksheet, students plot the points on the graph to create a picture of a Christmas tree. Students plot 37 points and connect them where told to.
Curated OER
Coordinates
In this geometry worksheet, 10th graders are given points on a coordinate plane, and they must figure out what the x and y values are. There are 6 graphing question.
Virginia Department of Education
Curve of Best Fit
Which function models the data best? Pupils work through several activities to model data with a variety of functions. Individuals begin by reviewing the shapes of the functions and finding functions that will fit plotted data points. By...
EngageNY
Multi-Step Problems in the Real World
Connect graphs, equations, and tables for real-world problems. Young mathematicians analyze relationships to identify independent and dependent variables. These identifications help create tables and graphs for each situation.
Curated OER
Ice Cream Lab
This very thorough lesson plan has learners collect all ingredients necessary and work in pairs to make ice cream using plastic bags. They take temperature readings and record them on the chart as well as record findings on the...
