Curated OER
Graphing Nonlinear Equations
Learners graph non-linear equations. In this algebra instructional activity, students investigate different polynomial functions and their shapes. They identify the different powers and zeros.
Curated OER
Intermolecular Forces
In this intermolecular forces activity, students perform a simple experiment with water to observe the intermolecular forces that hold water together as they fill a beaker as much as possible. They explain the results of their...
California Education Partners
Colorful Data
Scale up your lessons with a performance task. Young data analysts work through an assessment task on scaled bar graphs. They answer questions about a given scaled bar graph on favorite colors, analyze a bar graph to see if it matches...
Concord Consortium
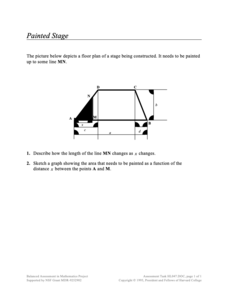
Painted Stage
Find the area as it slides. Pupils derive an equation to find the painted area of a section of a trapezoidal-shaped stage The section depends upon the sliding distance the edge of the painted section is from a vertex of the trapezoid....
Curated OER
Getting the Goods on Graphing
Students explore graphing. For this math lesson plan, students graph ordered pairs in the coordinate plane, write the coordinates of points shown on a plane, and create designs or pictures using ordered pairs.
Curated OER
Boots
In this graphing practice worksheet, 5th graders plot squares on a graph with an x and y axis. Once students locate each square they must color a certain design in that box to create a larger picture.
Curated OER
Geometry: Helix-a-Graph
Learners use geometry to create art. In this geometric graphing and patterns lesson, students create a helix-a-graph by plotting points on a grid that follow a certain pattern and analyze the drawing they created.
Curated OER
Pictures, Graphs and Diagrams
For this algebra worksheet, students define vocabulary related to circles, and other conics. They graph hyperbolas and eclipse. There are 20 questions.
Curated OER
Graphs
Students listen to the book, TOPS AND BOTTOMS looking at different vegetables from the story that they have tried in class that week.
They then focus their attention on a graph called, "What is Your Favorite Vegetable?". They place a...
Curated OER
Fast Food Survey Using Bar Graphs
Second graders conduct survey and sort data according to categories, construct bar graph with intervals of 1, and write a few sentences about their graphs.
Inside Mathematics
Population
Population density, it is not all that it is plotted to be. Pupils analyze a scatter plot of population versus area for some of the states in the US. The class members respond to eight questions about the graph, specific points and...
Inside Mathematics
Snakes
Get a line on the snakes. The assessment task requires the class to determine the species of unknown snakes based upon collected data. Individuals analyze two scatter plots and determine the most likely species for five...
Balanced Assessment
On Averages and Curves
Determine the average on a curve. The class finds graphical representations of averages and expresses them both symbolically and on the graph. The assessment requires class members to justify using average to describe graphs.
Shodor Education Foundation
Derivate
Derive tangent lines through derivatives. Scholars use an app to graph functions and investigate derivatives and tangent lines. The interactive automatically graphs a tangent line at a specified point and can also produce tables of values.
Math Drills
Christmas Cartesian Art Santa
Santa has his eye on you in a graphing activity that has young mathematicians plot ordered pairs on a Cartesian plane. After joining the points together, a picture of jolly Santa Claus comes to life.
Math Drills
Christmas Cartesian Art Tree
Spruce up graphing practice with an activity that has young mathematicians plot points on a coordinate plane, and then connect the points to create a Christmas tree.
101 Questions
Deodorant
Smells like learning! Young scholars collect data on the length of time a stick of deodorant lasts. After modeling the data with a graph and function, they make predictions about deodorant use over time.
Syracuse University
Erie Canal
While canals are not the way to travel today, in the first half of the nineteenth century, they were sometimes the best way to move goods and people. Scholars examine primary sources, including maps and pictures, to investigate the role...
Curated OER
You Can Get There From Here - Plotting on a Coordinate Plane
For this plotting worksheet, students plot given ordered pairs on a coordinate plane. After plotting each ordered pair, students connect line segments in consecutive order. Upon completion of the graphing exercise, students will have...
Curated OER
Graphing in Science
Students manipulate and interpret data. They are given a dataset from a described experiment and interpret the data. A "How to Sheet for graphing" is included in lesson plan.
Curated OER
Interpreting and Displaying Sets of Data
Learners explore the concept of interpreting data. In this interpreting data lesson, students make a line plot of themselves according to the number of cubes they can hold in their hand. Learners create their own data to graph and...
Curated OER
Gingerbread Man Math
Students collect and explore gingerbread man data. In this math and technology lesson plan, students examine how to organize and interpret data in three formats: objects, pictures, and graphs.
Curated OER
Temperature
Students explore the concept of temperature. For this temperature lesson, students read thermometers in degrees Celsius. Students discuss the temperature of the seasons and what clothing they might wear given a certain temperature....
Curated OER
Civil War Research
Eighth graders research different aspects of the Civil War using various multi-media techniques. Students create a report based on their research that includes views of the war from the point of view of the North, South and slaves.


