Curated OER
Gold Rush California and its Diverse Population
Students compare contemporary cultural differences with historical differences based on population percentage. In this cross-curriculum Gold Rush/math lesson, students analyze aspects of California's Gold Rush population and diversity...
Population Connection
Where Do We Grow from Here?
Did you know that the population is expected to grow to 11 billion by 2100? The resource serves final installment in a six-part series on the global population and its effects. Scholars interpret data from the United Nations about the...
Curated OER
Populations and Life Cycles
Students explore biology by researching ocean statistics. In this data analysis lesson, students conduct a snail examination experiment utilizing live pouch snails. Students collect data about the snails over the course of six weeks and...
Centers for Disease Control and Prevention
Major Disparities in Adult Cigarette Smoking Exist Among and Within Racial and Ethnic Groups
Data indicates that some racial groups smoke more than others, and that with that racial group, there are smaller groups whose smoking habits vary as well. Secondary learners read a graph that details the differences between the Asian...
Curated OER
Aboriginal Statistics
Fourth graders analyze statistics of Native Americans by creating graphs. In this data analysis lesson, 4th graders define different statistical terms and practice finding those statistics from groups of numerical information about...
Curated OER
Graphing Population Around the World
Young scholars define specific vocabulary necessary for understanding population data. They collect, analyze, and interpret specific data. They utilize computer programs in order to create graphs of collected data.
Curated OER
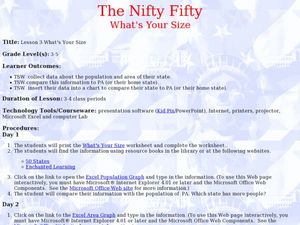
The Nifty Fifty-What's Your Size?
Students explore state populations. In this state geography lesson, students use a variety of technology tools to research and graph population and area of assigned states.
Curated OER
The Coyote Population: Kansas Prairies
Students discover animal lifestyles by researching their ecosystem. In this animal statistics lesson, students research the geography of Kansas and discuss the reasons why wild animals survive in the open Kansas fields. Students complete...
Curated OER
CSI Rhino
Students study the rhinoceros and how the species has survived for so long. In this rhino lesson students create graphs and research what is being done to protect the rhino.
Curated OER
Pika Chew
Students work in collaborative teams with specific roles, use the Internet to research the behavior and ecology of pikas, make predictions about survival rates of pikas in different habitats and organize their data in graphs.
Curated OER
Scatter Plots
In this scatter plots learning exercise, students solve and complete 4 different problems. First, they use the table shown to model the relation with a scatter plot and trend line and to predict the value of a variable when given the...
Curated OER
The World is a Village
Students observe Americans through the eyes of the world. In this human population lesson plan, students utilize the Internet to view the World Pop Clock and follow the world's population by the minute. Students predict what...
Curated OER
Wolves
Students explore wolves. In this ecology and wolves lesson, students research predator-prey relationships on the Internet and complete a related worksheet with a partner. Students interpret data on bar graphs to determine growth and...
Curated OER
Traveling with Flat Stanley
students use the internet to gather geographical data about a state of their choice. Using new vocabulary, they describe the features present in the state, its climate and attractions. They develop a PowerPoint presentation to share...
Curated OER
Living in an "Olympic" Country
Learners research countries participating in the Olympic Games. They create a database which includes graphs for comparing population density, the number of athletes, per capita income, etc. for each country. This project is completed...
Curated OER
Poetic Math Greeting Cards
Fourth graders work in groups; collect data in a survey; depict in tables, charts, or graphs the results of the survey; and make predictions. They use creative writing skills and computer skills to generate a greeting card of their own.
Curated OER
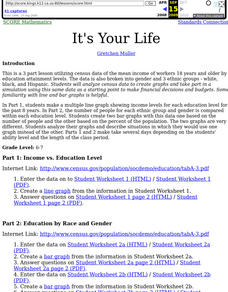
It's Your Life
Students make a multiple line graph showing income levels for each education level for the past 8 years and the number of people for each ethnic group and gender is compared within each education level.
Scholastic
Opioids and the Overdose Epidemic
Learn about the opioid and overdose epidemic in America with an article that explains what opioids are, how they are used, and how they are abused. Learners discover the death rates associated with opioid overdoses and other factors that...
Curated OER
Sample This
Students gain a greater understanding of how statistical samples are conducted by taking polls of specific populations. These polls be expressed in graphs, which be compared with the same questions asked of other populations.
Curated OER
Social Studies: Canadian City Comparison
Students research Canadian population distribution while comparing and contrasting the quality of life in two cities. They discuss issues and problems that cities and rural towns face. Students apply various methods, such as graphs and...
Curated OER
Carbondale: The Biography of a Coal Town
Students use a brief history of the growth and decline of the anthracite region in the state to create a photograph and map "peak shaped" time line. They practice map and photo analysis strategies to "read" photographs and maps.
Curated OER
Cyber Bullying
Cyber bullying is an important topic to address with middleschoolers. Here, learners take an active role in identifying and discussing this issue. Reviewing this resource with your class will help to equip them to be a part of the...
Curated OER
Louisiana Regional Foodways
Students strengthen their research techniques in locating, selecting, and synthesizing information from a variety of texts, media, references and internet resources to study regional food way traditions in Louisiana. They assess the...
Curated OER
Let Me Tell You About My State
Fifth graders research one of the 50 U.S. States that they were unfamiliar with. In this U.S. Geography lesson, 5th graders utilize encyclopedias as well as the Internet to research a chosen U.S. State in order to write a report....


