Mathematics Assessment Project
Linear Graphs
A line is a line is a line. As a middle school assessment task, learners first identify graphs of given linear equations. They then identify the equations that represent real-world situations.
Curated OER
Absolute Value and Basic Operations With Real Numbers
Middle schoolers investigate the mathematical concept of absolute value by counting the number of steps taken in two directions. Using the number line the teacher can note how they can forward and backward without changing the absolute...
Illustrative Mathematics
Irrational Numbers on the Number Line
There are four irrational numbers that participants need to graph. Pi(π), -(½ x π), and √17 are easy to approximate with common rational numbers. On the other hand, the commentary describing the irrational number 2√2 is not clear. It...
Charleston School District
Graphing Functions
How do letters and numbers create a picture? Scholars learn to create input/output tables to graph functions. They graph both linear and nonlinear functions by creating tables and plotting points.
Inside Mathematics
Graphs (2006)
When told to describe a line, do your pupils list its color, length, and which side is high or low? Use a instructional activity that engages scholars to properly label line graphs. It then requests two applied reasoning answers.
Curated OER
Exploring Real Numbers
In this algebra learning exercise, 11th graders classify numbers as rational, irrational, integral and whole. They solve the equations and graph i ton a number line. There are 26 questions with an answer key.
Curated OER
Piecewise Linear Functions: Extending Stories to Graphs
Using this resource, scholars develop graphs that model situations by showing change over time. They answer 15 questions based on information from charts that show growth in weight. They extend the concepts to an assessment section of...
Curated OER
Read My Bar Graph!
Elementary schoolers make and use bar graphs to picture information. They learn how choosing the right scale for a bar graph can help make a persuasive argument. This is a terrific lesson on graphing which should excite your kids. There...
Curated OER
Reading Bar Graphs #2
Raise the bar in your third grade class with this learning exercise on bar graphs. Youngsters view three graphs representing three different sets of data, and answer questions based on what they analyze. The first set is completed as an...
EngageNY
Overcoming a Third Obstacle to Factoring— What If There Are No Real Number Solutions?
Time for pupils to use their imagination! Learners examine the relationship between a system with no real solution and its graph. They then verify their discoveries with algebra.
Curated OER
Complex Distance
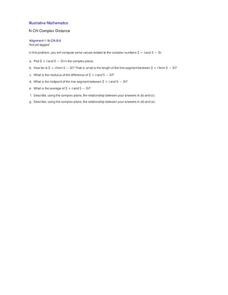
Have learners graph complex numbers to gain a visual and mathematical understanding of the distance and the midpoint between two complex numbers. This lesson is short, but to the point, and addresses an important complex number concept....
EngageNY
An Appearance of Complex Numbers 2
Help the class visualize operations with complex numbers with a lesson that formally introduces complex numbers and reviews the visualization of complex numbers on the complex plane. The fifth installment of a 32-part series reviews the...
EngageNY
Real-World Positive and Negative Numbers and Zero II
Continuing from the previous lesson in the series, scholars learn to use positive and negative integers to describe real-world situations. In groups, they come up with their own situations for given positive and negative integers.
EngageNY
Real-World Positive and Negative Numbers and Zero
Class members investigate how positive and negative numbers are useful in the real world. Individuals first read a short passage and identify terms indicating positive and negative numbers. They consider situations involving positive...
EngageNY
Analyzing Graphs—Water Usage During a Typical Day at School
Connect your pupils to the problem by presenting a situation with which they can identify. Individuals analyze a graph of water use at a school by reasoning and making conclusions about the day. The lesson emphasizes units and labels of...
Inside Mathematics
Vencent's Graphs
I like algebra, but graphing is where I draw the line! Worksheet includes three multiple-part questions on interpreting and drawing line graphs. It focuses on the abstract where neither axis has numbers written in, though both are...
World Wildlife Fund
Graphs and Charts
A two-part worksheet incorporating bar graphs and pie charts, young mathematicians can practice their graphing skills. Pupils answer questions using graphs and charts but are also challenged to create their own using a given set of data.
Houston Area Calculus Teachers
Polynomial Graphing
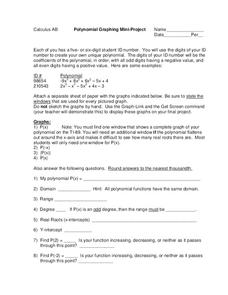
Your AP Calculus learners probably have their ID numbers memorized, but have they tried graphing them? Pique your pupils' interest by asking each to create a unique polynomial function based on their ID numbers, and then analyze the...
Illustrative Mathematics
Logistic Growth Model, Abstract Version
Here learners get to flex some serious algebraic muscles through an investigation of logistic growth. The properties of the constant terms in the logistic growth formula are unraveled in a short but content-dense activity. Moving...
Inside Mathematics
Graphs (2007)
Challenge the class to utilize their knowledge of linear and quadratic functions to determine the intersection of the parent quadratic graph and linear proportional graphs. Using the pattern for the solutions, individuals develop a...
Alabama Learning Exchange
As If Numbers Weren't Complex Enough Already!
The class explores the concept of complex numbers on a website to generate their own Mandelbrot sets. They will practice performing operations with complex numbers and then to get a visual understanding, graph the absolute value of a...
Curated OER
Whole Numbers
A game is a great way to learn. Study what makes an integers, their traits, and characteristics. This lesson includes 3 separate activities intended to promote an understanding of integers, whole numbers, and opposites. The class is...
Curated OER
Ornithology and Real World Science
Double click that mouse because you just found an amazing lesson plan! This cross-curricular Ornithology lesson plan incorporates literature, writing, reading informational text, data collection, scientific inquiry, Internet research,...
EngageNY
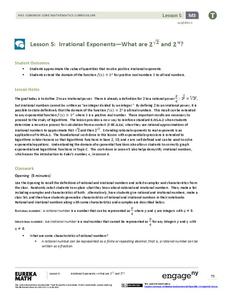
Irrational Exponents—What are 2^√2 and 2^π?
Extend the concept of exponents to irrational numbers. In the fifth installment of a 35-part module, individuals use calculators and rational exponents to estimate the values of 2^(sqrt(2)) and 2^(pi). The final goal is to show that the...


