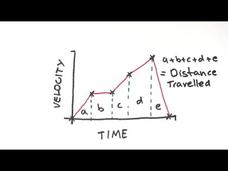
DoodleScience
Distance-Time and Velocity-Time Graphs
It's story time! Show your class how to use a distance-time graph to tell a story. They learn to draw and analyze a graph using distance and time data. The story then continues to compare velocity and time.
Corbett Maths
Travel Graphs
No need to travel ... the lesson will come to you! A well-designed lesson begins by describing the rate of change of a distance-time graph highlighting areas of constant, increasing, and decreasing speed. The video instructor then shows...
Corbett Maths
Area under a Graph
What? The calculation of area is a linear distance? A short video shows how to use the areas of simple polygons to estimate the area under a graph. Pupils divide the area under a curve into figures to easier calculate the area. Given...
Khan Academy
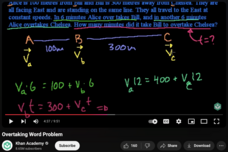
Overtaking Word Problem
These types of problems cause many people to be distressed over algebra. In this video, Sal looks at a problem where three people, each at set distances apart, are traveling at different constant speeds. We need to know how long it will...
Khan Academy
Khan Academy: Position vs. Time Graphs
This video teaches the viewer how to read a position vs. time graph. It explains how to use the graph to determine the following quantities: displacement, distance, average velocity, average speed, instantaneous velocity, and...
Khan Academy
Khan Academy: Why Distance Is Area Under Velocity Time Line
Understanding why distance is area under velocity-time line. [9:25]


