Curated OER
Weather With a Latitude
Students read the temperature from a thermometer. In this weather lesson, students read a thermometer and record the temperature at twenty minute intervals. Students discuss results.
Chicago Botanic Garden
GEEBITT (Global Equilibrium Energy Balance Interactive TinkerToy)
Students use the GEEBITT excel model to explore how global average temperatures are affected by changes in our atmosphere in part two of this series of seven lessons. Working in groups, they discuss, analyze graphs, and enter data to...
NOAA
History's Thermometers
How is sea coral like a thermometer? Part three of a six-part series from NOAA describes how oceanographers can use coral growth to estimate water temperature over time. Life science pupils manipulate data to determine the age of corals...
Curated OER
How Does Temperature Vary Over Time?
Pupils examine the temperature flucuations on the Earth. After defining new vocabulary, they identify the flucuations of the Earth on a map. As a class, they develop a hypotheis on the temperature variation by examining the data.
Curated OER
Cruise Conditions Graphing & Statistics
Students monitor weather conditions for an eighteen day period at a specific location. The temperature of both air and water is taken and the mean, median, and mode calculated. Differences between the highest and lowest recordings are made.
Curated OER
Graphing
Seventh graders identify the different graphs used in science. In this graphing lesson, 7th graders analyze the three kinds of graphs. They construct a graph that best describes a given data.
Chicago Botanic Garden
Historical Climate Cycles
Ice core samples give scientists access to climates of old—those from more than 800,000 years ago. Through an analysis of various temperature graphs from ice cores, tree rings, and weather stations, scholars compare historical climates...
Curated OER
Twinkle, Twinkle, Little Star Lab
In this space science worksheet, 7th graders use the star circles given but the teacher to complete 14 short answer questions. They plot the stars on the graph.
Curated OER
What Temperature Is It?
Young scholars use the internet to research information on the average maximum and minimum temperature for a city in their state. They create spreadsheets and enter data to analyze the information, focusing on averages, maximums,...
Curated OER
Trends of Snow Cover and Temperature in Alaska
Students compare NASA satellite data observations with student surface measurements of snow cover and temperature. They practice data collection, data correlations, and making scientific predictions.
Curated OER
Temperature and Pressure on Airplane Surfaces
Young scholars use the Internet to delve into the relationship between fores and motion on a sizable object. They predict where they think the temperature and pressure be the greatest, and where the pressure be the lowest.
Chicago Botanic Garden
Unit 2 Pre-test, Grades 7– 9
This pre-assessment launches a unit on climate change and weather. 15 questions, both short answer and multiple choice, asses the classes' knowledge about these concepts.
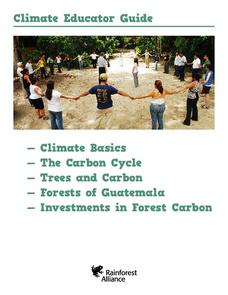
Rainforest Alliance
Climate Educator Guide
Climate change is a hot topic in the news. Class members examine carbon dioxide data to analyze trends of our atmospheric makeup over time. They also discuss climate and climate change, and determine how these changes are affecting life...
Curated OER
The Effect of Dissolved Salt on the Boiling Point of Water
Explore the properties of solutions with a lab activity. Chemistry fans determine the boiling point of water, add salt to create a solution, and then repeat the process four more times. They design their own data table and then graph the...
EngageNY
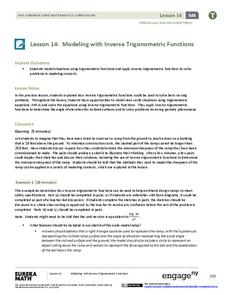
Modeling with Inverse Trigonometric Functions 2
Use inverse trigonometric functions to work with ramps, rabbits, and Talladega. The class models real-world situations with trigonometric functions and solves them using inverses in the 15th installment of a 16-part series. Pupils solve...
Curated OER
The Reason for the Seasons
Young scholars compare graphs of their data that was generated on a NASA website. In this seasons lesson students complete a lab activity.
Curated OER
"Dead-Zones" and Coastal Eutrophication: Case-Study of Chesapeake Bay
Take an in-depth look at nutrient loading, eutrophication, and hypoxia using data on The Chesapeake Bay as an example. This comprehensive presentation includes detailed graphs, photos, and details about the changes in marine organism...
Teach Engineering
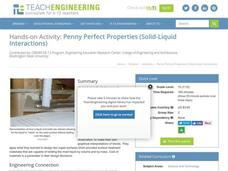
Penny Perfect Properties (Solid-Liquid Interations)
I can get more water to stay on a penny than you can! Collaborative pairs determine the volume of liquids that can be contained on the surface of copper pennies and plastic coins. The pairs analyze their results using graphs and go on to...
Curated OER
Tides in the Hudson
Students view an illustration of the Hudson River watershed and identify the bodies of water shown. They discuss what happens when fresh and salt water mix. Students view a teacher demonstration of the stratification of fresh and salt...
Curated OER
Good Weather
In this graphing data worksheet, students complete a temperature chart and then answer two questions about the weather for that week.
Curated OER
Plot! Analyze! Draw your Conclusions!
Students download data reported from the Global Sun Temperature Project website. They graph and analyze the data looking for trends and patterns. They prepare a class report with their observations and post it to the website.
Curated OER
Weather and its Effect on the Environment and Settlement
Young scholars, after choosing two diverse cities, collect data on weather for a month and construct a graph on temperature and precipitation. After collecting population data of said cities, and graphing it, they plot population on a...
Curated OER
Sea Level Trends ~ Ocean Front Property: An "Immerging" Market
Young oceanographers take a look at sea level data from several cities over a few centuries. They use the data to fuel a discussion about what kind of changes are taking place and the impact they are having on the coastal ecosystems....
Curated OER
Global Warming - The Heat is On: Global Climate Change Revisited
After listening to your lecture on climate change, young scientists access NOAA's database listing Mauna Loa's carbon dioxide data. They graph the monthly means and then compare their graphs to NOAA's. This is a concise plan that could...


