California Academy of Science
California's Climate
The United States is a large country with many different climates. Graph and analyze temperature and rainfall data for Sacramento and Washington DC as you teach your class about the characteristics of Mediterranean climates. Discuss the...
Curated OER
Picture This: Election Results Graphs
Students use art supplies or a free online tool to graph election results. Students follow local election and results. Using "Create a Graph, a free online graphing tool, they make a graph of the results.
Towson University
Looking Backwards, Looking Forward
How do scientists know what Earth's climate was like millions of years ago? Young environmental scholars discover how researchers used proxy data to determine the conditions present before written record. Grouped pupils gain experience...
Curated OER
Microbe Power - Using a Winogradsky Column as a Battery
In this instructional activity the student demonstrate analysis of the changes taking place in the bottle as well as bdemonstrate application of the interactions happening in the bottle by applying these changes to the environment.y...
Teach Engineering
Pointing at Maximum Power for PV
Following detailed directions, teams collect the voltage and current outputs of a photovoltaic cell by adjusting the resistance. Using the collected data, they determine the highest power output. Implications for weather and a large...
Curated OER
The Foods we Eat (Los Alimentos)
Sixth graders sing a song and create flashcards showing their favorite foods. In this Spanish "What do you like? lesson, 6th graders display Spanish foods using a document camera and graph their favorites.
Curated OER
Discovering Ohm's Law
Connect math with science! Pupils apply properties of Ohms Law as they solve problems and identify the inverse relationship of a function. They analyze the shape of the graph of an inverse function and use it to make predictions.
Curated OER
Ohm's Law
If your future physicists know how to construct simple circuits, include resistors, and use a multi-meter to measure voltage, then you might employ this lesson on Ohm's law. Each lab group investigates the relationships among...
Curated OER
Microbe Power- Using a Winogradsky Column as a Battery
Students demonstrate the changes that take place when they complete their experiment. In this battery lesson students complete a lab activity.
Curated OER
How Fast is it Traveling?
Students calculate the rate of speed of various moving objects within the classroom setting, or outside under a controlled environment.
Curated OER
Illuminating Climate Change: Connecting Lighting and Global Warming
Students analyze energy usage and connect energy usage to fossil fuel consumption. In this global warming and pollution lesson, students what fuels are used to generate electricity and how much CO2 each fuel produces, then graph the...
Curated OER
Elementary Concepts in Heat
Third graders read a thermometer with accuracy, record observations and data, and infer conceptual meaning. They integrate mathematical charting and graphing skills to organize their data. They explore what happens when they touch or use...
Curated OER
From Playing with Electronics to Data Analysis
Learners collect and Analyze data. For this statistics lesson, students identify the line of best fit of the graph. They classify lines as having positive, negative and no correlation.
Curated OER
Pythagorean Triples
Students investigate the mathematical concepts related to the study of The Pythagorean Theorem. They graph and review how to use a line segment to construct a triangle. Then using the theorem students calculate the length of the hypotenuse.
Curated OER
Introduction to the Oscilloscope as a Voltmeter
Students measure the electric potential of 9 volt batteries using oscilloscopes. They draw a diagram of the front panel of the oscilloscope, conduct the experiment, and create a graph of voltage versus the number of batteries.
Curated OER
Human Activity and Cllimate Change
Students perform activities to explore the affect of human activity on climates. They examine graphs of GHG emissions and their increases that are associated with human activity. Using a Global Climate Changing website, students explore...
Curated OER
Making a Cartogram
Students interpret statistical geographic information by creating a cartogram.
Curated OER
Approximation of Pi
Young scholars explore the concept of Pi. In this Pi lesson, students measure the circumference and diameter of a circle. Young scholars record the diameter and circumference measurements from their classmates. Students...
Curated OER
My Pyramid for Kids
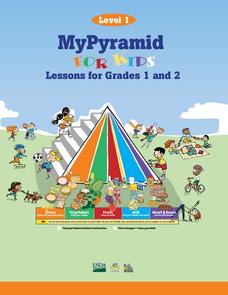
Students become familiar with the proper amounts of different types of foods they should eat each day. In this food pyramid activity, students complete worksheets to develop better eating habits. Students understand the importance of...
Curated OER
Ozone
Students locate the ozone layer of the atmosphere. They explain natural formation of ozone. They list chemicals that react with ozone. They explain how CFC's destroy ozone.
Curated OER
Wsshington Monuments Projects
Eighth graders choose a landmark or monument to investigate (individually or with a partner). After agreeing on items to study they research the landmark/monument and prepare a presentation.


