EngageNY
The Graph of a Linear Equation in Two Variables Is a Line
Show your class that linear equations produce graphs of lines. The 20th segment in a unit of 33 provides proof that the graph of a two-variable linear equation is a line. Scholars graph linear equations using two points, either from...
EngageNY
Interpreting Quadratic Functions from Graphs and Tables
Seeing functions in nature is a beautiful part of mathematics by analyzing the motion of a dolphin over time. Then take a look at the value of a stock and maximize the profit of a new toy. Explore the application of quadratics by...
Mathematics Assessment Project
Representing Quadratic Functions Graphically
Sometimes being different is an advantage. An engaging activity has scholars match cards with quadratic functions in various forms. Along the way, they learn about how each form highlights key features of quadratic functions.
EngageNY
Graphing Rational Functions
Put everything together in a picture. Scholars take what they learned in the previous three lessons in the 15th segment of a 23-part unit to graph rational functions. They find the end behavior, the horizontal and vertical asymptotes if...
Curated OER
Graphing at all Levels: It's a Beautiful Thing!
Mixing math and art is done in this lesson by applying graphing knowledge to create a unique piece of art. This lesson varies acording to the graphing knowledge of the artist. First, learners identify and review various types of graphing...
Curated OER
Graphing Inequalities
Students solve inequalities and graph. In this algebra lesson, students rewrite inequalities in the slope intercept form and graph using the slope and intercept. They shade the correct side of the line using greater than or less than as...
Curated OER
Linear Functions: Slope, Graphs, and Models
This math packet provides an opportunity for learners to graph two linear equations on a coordinate grid and determine the slope and y-intercept of each. They use the equation of five lines to find the slope and y-intercepts, and then...
Curated OER
Graphs and Transformations of Functions
Is it possible to solve quadratic equations by factoring? It is, and your class will graph quadratic equation and functions too. They perform transformation on their graphs showing increasing and decreasing intervals, domain, and range....
Curated OER
Graphs of the OTHER Trig Functions
Students graph trigonometric functions. In this precalculus lesson, students identify the properties of secant ,cosecant and cotangent. They use the unit circle as their formula to graph and analyze these functions.
Curated OER
Slope-Intercept Form of a Line
Using the subscriber website Explorelearning.com, young mathematicians observe changes in the slope and y-intercept and their effect on the graph of lines. This activity helps students develop an intuitive sense of the connection between...
EngageNY
Structure in Graphs of Polynomial Functions
Don't allow those polynomial functions to misbehave! Understand the end behavior of a polynomial function based on the degree and leading coefficient. Learners examine the patterns of even and odd degree polynomials and apply them to...
Curated OER
Point-Slope Form of a Line
This activity helps young mathematicians connect the graph and the point-slope form of a line, by first solving a real-world problem and then using that example to motivate the understanding of the equation. By manipulating the gizmo,...
Curated OER
Graphing Exponentials
Bring your Algebra class to the computer lab! Using materials created by Texas Instruments, they explore exponentiasl and graphs. Be sure to download the correct materials (on the right side of the webpage) before having them walk...
Curated OER
What Functions do Two Graph Points Determine?
Your algebra learners write linear, exponential, and quadratic equations containing the same two graph points in this collaborative task.
Virginia Department of Education
Rational Functions: Intercepts, Asymptotes, and Discontinuity
Discover different patterns by making connections between a rational function and its graph. An engaging instructional activity asks scholars to explore the behavior of different rational functions. Groups discover a connection between...
Curated OER
US Airports, Assessment Variation
Determining relationships is all part of algebra and functions. Your mathematicians will decide the type of relationship between airports and population and translate what the slope and y-intercept represent. The problem is multiple...
Curated OER
Intercepting Villans Using the Correct Rate
A Cyberchase video introduces the distance = rate x time equation. Participants then calculate answers to proposed problems and graph a series of results that is then incorporated into a game to help cement the concept. A thorough and...
Curated OER
More Graphing With Intercepts
For this graphing worksheet, young scholars graph linear equations. They identify the x or y-intercept. Coordinate planes are available below each equation. Nine problems are provided on this two-page worksheet.
Mathematics Assessment Project
Classifying Equations of Parallel and Perpendicular Lines
Parallel parking might be difficult, but finding parallel lines is fairly simple. In this lesson, learners first complete an assessment task involving parallel and perpendicular lines in the coordinate plane. Individuals then take part...
EngageNY
Analyzing a Graph
Collaborative groups utilize their knowledge of parent functions and transformations to determine the equations associated with graphs. The graph is then related to the scenario it represents.
Curated OER
Matchstick Math: Using Manipulatives to Model Linear, Quadratic, and Exponential Functions
Playing with matches (unlit, of course) becomes an engaging learning experience in this fun instructional unit. Teach pupils how to apply properties of exponential functions to solve problems. They differentiate between quadratic and...
Curated OER
Analyzing Equations Through Slope and Y-int
With problems applying to modern-day topics like Netflix and McDonald's, math whizzes analyze graphs and investigate the slopes. In this algebra worksheet, learners identify the slope and y-intercept of the given equations. They graph...
Curated OER
Solar Kit Lesson # 12 - Calibration Curve for a Radiation Meter
Scientists need to have mastered algebraic slope-intercept concepts in order for this lesson to be effective. They will measure and graph solar panel output as a function of the amount of radiation striking it, discovering that there is...
Curated OER
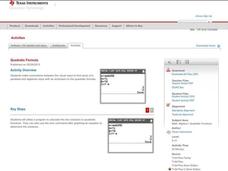
Quadratic Formula
This worksheet is part of the TI-Nspire lesson on the quadratic formula. Pupils determine the solutions of a quadratic function by looking at a graph and the discriminant. They use the quadratic formula to solve quadratic functions on...


