Curated OER
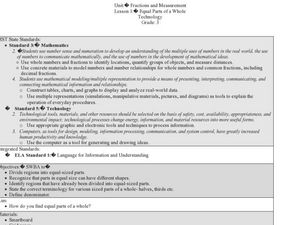
Fractions and Measurement
Using a Smart Board, or a plain ol' white board or chalkboard, the teacher pulls up a grid and demonstrates how squares and rectangles can be divided up into equal parts. The class will get their own graph paper to draw shapes and divide...
Shmoop
ELA.CCSS.ELA-Literacy.RI.11-12.7
Comparing information found in images, charts, and graphs with that found in written text can be a challenge for even senior high scholars. Provide learners with an opportunity to practice this skill with an exercise that asks them to...
Curated OER
The Air Up There
Young scholars observe the weather over a period of two weeks. They gather local weather data and calculate the mean and average figures from the data. They prepare a graph with their observations.
Curated OER
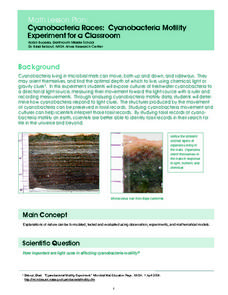
Cyanobacteria Races: Cyanobacteria Motility Experiment for a Classroom
Students experiment to determine the effect of light on cyanobacteria movement. They graph the data of the experiment for further analysis. They watch a time-lapse video of cyanobacteria motility at a NASA website.
Curated OER
Fresh Water and land of Kiribati and Hawaii (Molokai)
Fourth graders examine the islands of Hawaii. Using this information, they organize it and create a map or graph that represents the data. As a class, they discuss how the watersheds on the islands are different and how people react to...
Curated OER
How Times Have Changed
Fifth graders work in small groups to compile job changes. They use data from the list of changes that the group generated together. Students analyze the data to determine: categories of changes, patterns or trends of changes, and future...
Curated OER
Devising a Measure for Correlation
How well does your class understand the concept of correlation? Use an activity to explore different methods of calculating correlation. Working alone and then in groups, your class will make decisions on what math to apply to the...
Tech Know Teaching
5th Grade Constructed Response Question
New to constructed response question worksheets? Here's a model that demonstrates how to construct questions that require readers to interpret graphics found in informational text.
Illustrative Mathematics
Springboard Dive
Dive into this problem that illustrates a real-world application of the quadratic formula. Learners are given an equation that represents the height of a diver above the water t seconds after leaving the springboard. The task is to...
Curated OER
Data From Interviews
Learners create and conduct a survey about favorite foods, gather and represent the data, interpret data and make predictions to present to the class. They create and use interview questions to gather data. Pupils are explained that...
Curated OER
Lahar Travel Time
Ninth graders analyze published geologic hazard maps of California and comprehend how to use the map's information to identify evidence of geologic events of the past and present and predict geologic changes in the future. They select...
Alabama Learning Exchange
Scaling Down the Solar System
Learners work collaboratively to gain a better understanding of the vastness of space by scaling down the solar system. They measure by inches, gain an understanding of space, and model the distances of the planets from the sun.
Curated OER
My Test Book: Reading Pie Charts
In this math skills worksheet, students solve 9 multiple choice math problems that require them to read and interpret charts. Students may view the correct answers.
Curated OER
Measures of Central Tendencies: Quartiles
In this statistics instructional activity, students calculate the mean, median, mode, range, lower quartile, and upper quartile for 10 questions and interpret a box and whiskers graph.
Curated OER
Measures of Central Tendency
In this measures of central tendency worksheet, students find the mean, mode and range of given sets of data. They interpret box-and-whisker graphs and stem-and-leaf plots. This two-page worksheet contains eleven multi-step problems.
Curated OER
My Test Book: Tally Charts
For this online interactive math worksheet, students solve 10 problems that require them to read and interpret tally chart data. Students may submit their answers to be scored.
Curated OER
Draw Shapes on the Grid: Independent Practice 2
In this drawing worksheet, students draw shapes on a coordinate plane at the specified location. They interpret a given ordered pair and then draw a star, circle, triangle, or square as directed. This one-page worksheet contains two...
Curated OER
Frequency Table
In this frequency table worksheet, students create a frequency table from given data. They identify the mode. Students read and interpret frequency tables. This one-page worksheet contains 7 multi-step problems.
Curated OER
Plotting Wind Speed and Altitude
Young scholars construct, read and interpret tables, charts and graphs. They draw inferences and develop convincing arguments that are based on data analysis. They create a graph displaying altitude versus wind speed.
Curated OER
Mine Shaft Grade 8 Slope
Eighth graders investigate slopes using real life scenario. In this algebra lesson, 8th graders model and interpret real life data. They plot their data in a coordinate plane and discuss the results with the class.
Curated OER
Algebra: Reaching New Heights
Students work in pairs to measure their arm span and height and record them on a class chart. The class works together to create a scattergram to display the data. Class discussion focuses on interpreting the scattergram.
Curated OER
Be the Kiwi
Young scholars analyze linear equation. In this algebra activity, students analyze and graph data. They solve problems involving linear equations and graph lines using the slope and y intercept.
Curated OER
Income Levels & Social Class: Is It All About Cash?
Students graph data and interpret that data after reading information about lifestyles and income levels. They calculate percentages, set up spreadsheets and calculate columnar data.
Curated OER
Understanding History By How America Felt
Students explore public opinion of presidential decisions. In this history lesson, students examine various graphs that depict overall American approval of U.S. Presidents and government decisions then answer questions about the...
Other popular searches
- Interpret Charts and Graphs
- Interpreting Bar Graphs
- Interpreting Line Graphs
- Interpreting Circle Graphs
- Interpret Graphs
- Reading Graphs and Charts
- Graphs Interpreting Data
- Bar Graph Interpretation
- Reading Graphs in Science
- Timed Reading Graphs
- Interpreting Graphs Algebra
- Math Interpreting Bar Graphs
