Houghton Mifflin Harcourt
Use a Graph: Measure Fish
Something's fishy here! Use the bar graph provided to determine the length of each fish shown. Small cartoon fish make this an engaging worksheet for young learners. There are six questions provided.
Curated OER
Twelve Days of Christmas--Prediction, Estimation, Addition, Table and Chart
Scholars explore graphing. They will listen to and sing "The Twelve Days of Christmas" and estimate how many gifts were mentioned in the song. Then complete a data chart representing each gift given in the song. They also construct...
Curated OER
Interpreting Medical Data
Students explore human anatomy by graphing scientific data. In this vision lesson, students discuss how ophthalmology works and take their own eye assessment test using the Snellen chart. Students collect vision data from all of their...
Pennsylvania Department of Education
Equal Groups
Students explore statistics by completing a graphing activity. In this data analysis activity, students define a list of mathematical vocabulary terms before unpacking a box of raisins. Students utilize the raisins to plot data on a line...
Curated OER
Earth Energy Budget Pre Lab
Learners explore energy by conducting an in class experiment. In this climate change instructional activity, students conduct a water vapor experiment in a soda bottle. Learners utilize graphs and charts to analyze the results of the...
Curated OER
Interpreting a Pictogram
In this pictogram worksheet, students interpret a pictograph on ladybirds and answer 5 short answer questions or drawings referring back to the pictogram. Students carry out their own scenario pictogram and draw a table with their results.
Curated OER
Jim, Tony, and Frank - The School Fundraiser
In this bar graph worksheet, students use the horizontal bar graph to count how much money each student collected for their fundraiser. Students answer 10 questions.
Curated OER
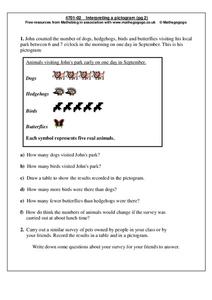
Interpreting a Pictogram
In this pictogram worksheet, students read and analyze a pictogram about dogs, hedgehogs, birds and butterflies and then answer 6 short answer questions. Students conduct a similar survey on pets owned by their friends and put their...
Curated OER
Survey Says...
Learners practice taking surveys to answer different questions about radio. In this communications lesson, students brainstorm to create questions they can ask strangers about how often they listen to their radio. Learners...
Curated OER
Songs from the Past
Young scholars research songs from the past to learn about historical events. In this music history lesson, students conduct a survey on the Star-Spangled Banner, research the song and history on various websites, and research songs in...
Curated OER
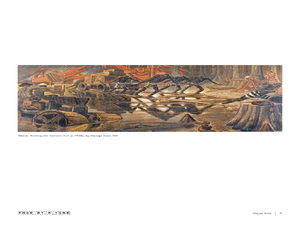
Analyzing Visual Symbols
Young scholars analyze and identify visual symbols in everyday life and during a museum visit. In this visual symbol lesson, students study associated vocabulary such as analyze and interpret. They find and note attention getting symbols...
Curated OER
Graphing Grazy Crayons
Children create crazy crayons they made to sort and construct a floor bar graph. Then, using technology resources, they make a simple bar graph to compare the top four colors produced. Students will then interpret the printed graph by...
Curated OER
Ornithology and Real World Science
Double click that mouse because you just found an amazing lesson! This cross-curricular Ornithology lesson incorporates literature, writing, reading informational text, data collection, scientific inquiry, Internet research, art, and...
Curated OER
ART PROJECT
Eighth graders, after researching the properties of graphs of conic sections, absolute value and inverse relations, make a drawing of precise functions and relations from a specified list of equations. The final design should analyze the...
Curated OER
1st Grade - Act. 04: Chrysanthemum and Letter Tiles
First graders listen to story Chrysanthemum, discuss story with a focus on the length of Chrysanthemum's name, and compare the lengths of their own names using letter tiles, grid paper, and a class graph.
Curated OER
Mathematical Models with Applications: The Sounds of Music
Students use an electronic data-collection device to model the sound produced by a guitar string. They identify the graph of a periodic situation and use the graph to determine the period and frequency of sound waves.
Curated OER
Jack-O-Lantern Glyph
Students create a jack-o-lantern glyph that accurately represents his or her answers to a series of questions. The completed jack-o-lanterns are displayed in the classroom and the class interprets the data.
Curated OER
Art and Anatomy: The Vitruvian Teen
Students are introduced to the history of showing the human anatomy. In groups, they measure their height and arm spans to create a graph and determine if their measurements support Vitruvius' work. Individually, they make their own...
Curated OER
Picture Fists Full of Kisses
Ease children's back-to-school jitters with this primary grade lesson based on the book The Kissing Hand by Ruth E. Harper. Starting off with a singing of the song "I Wish I Had a Little Red Box", children go on to discuss and...
Curated OER
Investigating Brass Instruments and Pitch
Students observe the sounds of different brass instruments in order to understand how to create different pitches. In this musical instructional activity, students create a "brass" instrument from everyday household objects. The students...
Maryland Department of Education
Our Children Can Soar
Amazing efforts of African American leaders are celebrated in a lesson on civil participation. The engaging resource focuses on primary and secondary sources to analyze the impact of African American leaders such as Ella Fitzgerald....
Curated OER
Can You Identify Arthropods?
Third graders sort and classify the four Arthropod classes. They are given puzzle pieces of one Arthropod example. Each group is to put their puzzle together, glue it on a piece of construction paper and label the ir puzzle.
Curated OER
Theobroma - Food of the Gods
Students discuss the history of cacao and its use in the production of chocolate. They analyze actual cacao pods and record their observations. Finally they create a five minute contour drawing of the cacao pod and seeds.
Curated OER
Treasure Hunters
Students design an on campus treasure hunt to find various architectural vocabulary words which they then create definitions for on the blog page on the Environmental Design website.
Other popular searches
- Interpret Charts and Graphs
- Interpreting Bar Graphs
- Interpreting Line Graphs
- Interpreting Circle Graphs
- Interpret Graphs
- Reading Graphs and Charts
- Graphs Interpreting Data
- Bar Graph Interpretation
- Reading Graphs in Science
- Timed Reading Graphs
- Interpreting Graphs Algebra
- Math Interpreting Bar Graphs


