Curated OER
Statistics with State Names
Students analyze the number of times each letter in the alphabet is used in the names of the states. In this statistics instructional activity, students create a stem and leaf plot, box and whisker plot and a histogram to analyze their...
Curated OER
At the Edge of the Continent
Students study how to interpret a bathymetric map. They study the main features of the continental margin. They plot and graph bathymetric data. They think about and discuss the bathymetry of the edge of the cont
Curated OER
Interpreting Data and Building Hypothesis
Students define the term species, and graph species data together with previously collected data at the National Zoo. They interpret graphed data and recognize patterns in the streamside quadrant versus hillside quadrant. Students use...
Curated OER
Download and Analyze
Students download information from a NASA website into a database. They transfer it to a spreadsheet by completing the information and analyze the information. They determine temperature averages, mode, and graph the results. They write...
Curated OER
The Phone Bill Problem
Students write an equation for a linear function. In this algebra lesson, students collect data, plot it and graph it. They identify the equation of the graphed data and define the slope and y-intercept of the graph.
Curated OER
Linear Equations in Our Every Day World!
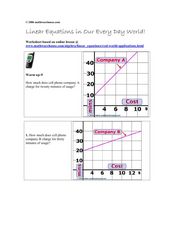
In this linear equations worksheet, students read and interpret graphed linear equations. They read a story problem, write a linear equation, and plot the points on a coordinate plane. This five-page worksheet cotnains 12...
Curated OER
A Steep Hike
Students explore slope. In this middle school mathematics lesson, students analyze and interpret graphs as they investigate slope as a rate of change. Students use a motion detector to collect data as they walk at different...
Curated OER
THEMIS: A Magnetic Case of 'What Came First?'
In this magnetic reconnection worksheet, learners solve seven problems using the data and graphs from the THEMIS satellite constellations, which show a series of events triggered by a magnetic reconnection. Students interpret the data in...
Curated OER
Piecewise Linear Integral
Young mathematicians solve and graph piecewise functions in this calculus lesson. They integrate linear functions containing restrictions and graph their answers using the TI.
Curated OER
Oodles of Poodles
Students solve equations by graphing. In this algebra lesson, students differentiate between functions and relations. They use the TI to graph their equation and analyze the graph.
Curated OER
The Apple Orchard Problem
Students explore various approaches to solving a problem of maximizing the total production of apples in an orchard. In this apple orchard lesson, students collect data in order to solve the apple orchard problem presented. Students plot...
Curated OER
Differences between Climate and Weather
Learners collect weather data over weeks, graph temperature data and compare the temperature data collected with averaged climate data where they live.
Curated OER
Temperature High and Lows
Students gather high and low temperature readings through email. In this temperature graphing lesson, students use a spreadsheet to input data for a graph. students interpret the graphs to compare and contrast the data from different...
Curated OER
Do the Elephants Need Sunscreen? A Study of the Weather Patterns in Etosha
Students analyze the weather patterns in Namibia. They create a graph of the yearly temperatures and use the internet to gather information. They discuss how the weather goes in cycles in the area.
Curated OER
Using Vegetation, Precipitation, and Surface Temperature to Study Climate Zones
Students begin their examination of the climate zones found around the world. Using a software program, they identify the relationship between the vegetation, climate and temperatures of the different zones. They also plot coordinates...
Curated OER
Insect Monitoring
Students participate in an interactive activity using the scientific method to study biodiversity. In this insect monitoring activity, students simulate the layers of soil and the insects that would live there. Students design...
Curated OER
Areas Under Curves: An Astronomical Perspective
In this area under the curve instructional activity, students use a graph of the number of exoplanets discovered and the year they were discovered to solve 5 problems. Students find the total area under the curve, they find the total...
Curated OER
Measuring Biodiversity
Young scholars collect species data from a mock intertidal community. In this biology lesson, students graph their data and analyze the species in it. They construct a species accumulation curve and present it to class.
EngageNY
Nonlinear Models in a Data Context
How well does your garden grow? Model the growth of dahlias with nonlinear functions. In the lesson, scholars build on their understanding of mathematical models with nonlinear models. They look at dahlias growing in compost and...
Curated OER
Price of Apples- Linear Data
Students collect data and create a graph. In this algebra lesson, students describe functions graphically, algebraically and verbally. They identify functions as being independent and dependent using variables.
Curated OER
How Much Will I Spend On Gas?
Students construct a linear graph. In this graphing lesson, students determine a monthly budget for gasoline. Students construct a t-chart and coordinate graph to display data. Resources are provided.
Curated OER
An Introduction to Functions
Students investigate the growth and decay of an exponential function. In this algebra lesson, students apply properties of exponent solve problems. They identify any patterns they see in the graphs.
Curated OER
This Old Tubeworm
Students plot data to construct and interpret a graph about vestimentiferans at cold-seep sites in the Gulf of Mexico. In this deep sea lesson, students plot data provided for the growth of tubeworms. They use the graphs to determine...
Curated OER
Graph Both Crusts
Fourth graders calculate the angles and construct a pie graph of the percentages of the elements in the continental and oceanic crusts. Then they analyze the results. They can be assigned the task of researching the percentages.


